.jpg "TradeWins Publishing")
Follow
Us:    
|
Get Instant Cash and
Pay 80% Less TODAY
Bubba’s Instant Cash Flow is completely SOLD OUT. And folks aren’t happy about it. No surprise there.
But here’s the crazy part...
In a generous show of good will, Bubba came up with an alternate plan that could be even better for you!
Bubba’s Classified Option Report
Bubba’s Classified Option Report delivers the same cut-and-paste profit opportunities as Bubba’s Instant Cash Flow...
And you’ll pay 80% less!
But, to maintain exclusivity, a very limited number of subscriptions will be available. And you know from experience they’ll be grabbed up fast.
So please do not hesitate... CLICK HERE to see if you can still get in.

|

How did an award-winning artist and sculptor, who owns an eclectic gift shop in Historic Biltmore Village, end up an option guru?
Let's see...
- The need to take immediate control of her financial future brought Wendy to option trading and the leverage it offers.
- Inspired to help other women enjoy the financial security she had found, Wendy launched WomenOptionTraders.com and began giving online classes.
- A natural-born teacher, her following grew quickly and so did requests for an easy-to-understand book on options. So in 2009 Wendy co-authored, with Virginia McCullough, “Option Trading In Your Spare Time—A Guide to Financial Independence for Women”.
- Then, in 2010 a major uprising... online traders, men and women alike, heard that Wendy’s P3 System produced nearly 100% winning trades and they wanted in.
- When TradeWins Publishing heard about Wendy’s miraculous discovery and tremendous success, they called her right away. The result is Wendy’s new book, which contains the most important parts from her “pink book” and a full-disclosure of her P3 System, in easy-to-follow, step-by-step detail.
|
Notice!!
“Former Gift Shop Owner
Survives Flood And Beats Every
Expert With Huge, Fast Gains
of 100%… 500%…
Even 1415%
in 6 Days!!”
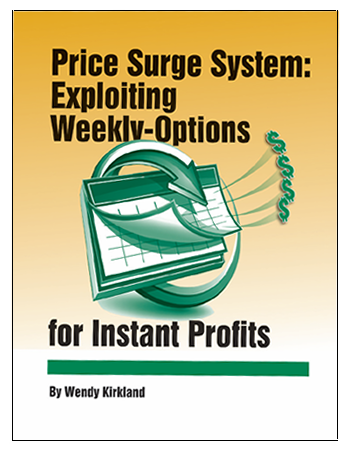
Announcing Wendy Kirkland’s
Personal
Price Surge System
The astounding Quick-Hit, Huge Profit Options Secret That Virtually GUARANTEES You Trading Success!
Until now, options trading strategies either provided high trading accuracy and small profits – or low accuracy with high profits. Now, this simple step-by-step system provides monstrous profits in just a few days… yet is highly accurate with better than 7 of every 10 trades winners.
And 88.5% of all winning trades more than doubling your money in just 4 days!!
Learn More About
Wendy Kirkland's
Price Surge System
|
|

Better
Business Bureau
|
|
Click on authors name
to learn more
|
| |
|
|
We feature Wendy Kirkland this week. Wendy explains how delta affects an option’s premium.
Then, Lee Gettess tells us what he expects from the bond and S&P markets for the coming week.
Next, Ray Frazier shares chart formations that indicate buy and sell signals in the marketplace.
Last, Chuck Hughes wraps up with his Guaranteed Real Optioneering Winners - Optioneering Newsletter.
Enjoy!
Adrienne LaVigne
TradeWins Publishing
 |
|
Delta for Each Strike Price
by
Wendy Kirkland
The following
is an excerpt from Wendy Kirkland's Price Surge System Manual
Each strike price incorporates a delta percentage number that is used in the calculation of its option premium. The deeper in-the-money (ITM) an option is, the higher the delta. Delta is one of the Greeks that play a part in option pricing.
You want to avoid the lure of an inexpensive option that is too far out-of-the-money (OTM). At first you assume you have found a great bargain, perhaps only $.16 per share, a total of $16 per contract. And you imagine getting 35 contracts for $576. But then, you check the deltas and find it is .09. For every dollar of the underlying asset’s price move, you get $.09 cents. You can see at that rate, it will take a long time for an option to cover the spread cost between the bid and the ask, plus the brokerage fees, much less ever get to the point where you realize a profit.
Therefore, we look to not only buy one strike out-of-the-money (OTM) or at-the-money (ATM), but the option should have a delta of .30 or better, preferably with a delta of .39 to .65. With that percentage or higher, you’ll make $.39 to $.65 or more for every dollar move of the underlying asset. Higher deltas have higher premiums.
With weekly options, the increase in deltas happens quickly. The delta might be .30 one day and after a small move, it could be .55 the next day and .80 the following day.
I have found that the greatest leverage happens on the option that is one strike OTM. Often this is the strike that would also be considered ATM. The delta is large enough to give you a nice increase as the equity price moves, but it also brings the delta up quickly, so that if your trade is working, the profits are compounded by delta and the large number of contracts that you were able to purchas
The image below is a chart showing the delta percentages for US Steel’s March 5th Week option that has 5 days until expiration. With the stock price at 29.74, the 29 strike price is .74 ITM and could be considered an in or ATM option. It has a delta of .6619. The ask premium price of $1.22 for the 29 strike call will move up .66 cents (rounded down) for every dollar move up in the stock’s price.
The 28 strike has $1.74 intrinsic value and is even deeper ITM. Therefore, the ask premium is higher than the 29 strike and so is the .8196 delta.
Delta for Each Strike Price
|
Lee
Gettess' Market Sense
by Lee Gettess
Lee
Gettess is a top trader who is excited
to bring you his video newsletter.
Each week, Lee will share his predictions
on what he anticipates from the bond
and S&P markets.
Watch
Video
|
Buy & Sell Signal Chart Formations
by Ray Frazier
The following
is an excerpt from Ray Frazier's Huge Profits Now!!
You can buy options on most stocks, but without knowing which direction a stock is more than likely to go, you are just guessing... which is inappropriate for anyone that is involved with stocks or options. That’s how so many people lose a great deal of money in the markets because they guess and hope too much!
So, how do you determine that a stock will make you money? How do you determine the direction a stock is likely to go? For me and many professional traders it’s all in the charts. For those of you that do know what a chart is – it is a collection of stock price movements that are updated every day.
There are many formations found in charts. It’s important to understand the different chart formations that occur, what they mean, and how to use them. Here we will talk about two important formations that indicate buy and sell signals in the marketplace.
Descending Channel Formation
This formation gives an excellent buy signal for investors. The descending channel formation is exactly what the name implies. During a downtrend, investors will come in and buy on the dips; which drives the price of the stock up. In turn, as the stock price goes up, sellers of the stock will come in and drive the stock price down. This will happen several times over a period of time. With each round of buying, the highs formed are lower each time and the lows are lower each time. Volume tends to decline as the channel is formed. Eventually, there are not enough sellers of the stock and buyers come in and take the stock price above the resistance line on higher volume.
Below is a chart showing a classic example of a descending channel formation. You will notice the stock price is trapped between two parallel trend lines. When the stock finally crosses the upper trend line, it will usually move up rapidly for the next month.
Buy & Sell Signal Chart Formations
|
Guaranteed Real Optioneering Winners
by Chuck Hughes
The following is an excerpt from Chuck Hughes' Optioneering Newsletter
Every week Chuck publishes his “Optioneering Newsletter”. The following is a trade opportunity taken from his most recent issue.
The first profit opportunity we will consider this week is in STMP, or Stamps.com Inc. Stamps.com provides internet-based mailing and shipping services that allow small businesses, online retailers, and other organizations to print official United States Postal Service stamps and shipping labels with their computer, printer and an Internet connection.
The monthly chart shows that STMP is in a strong bull trend. The daily chart for STMP shows a strong bull trend from the August low to the February high. A three-wave correction could be complete at this month’s low. If so, the next leg of the advance is just beginning.
We are going to review a call debit spread for STMP.
Traders who want to employ a more leveraged approach can buy STMP calls. STMP has options expiring every week until May 19th. After that, STMP has options expiring in August, November, January 2018, and January 2019. Click Here to follow this trade.
To Learn More Click Here
|
|