Buy & Sell Signal Chart Formations
By: Ray Frazier
The following is an excerpt from Ray Frazier's Huge Profits Now!!
You can buy options on most stocks, but without knowing which direction a stock is more than likely to go, you are just guessing... which is inappropriate for anyone that is involved with stocks or options. That’s how so many people lose a great deal of money in the markets because they guess and hope too much!
So, how do you determine that a stock will make you money? How do you determine the direction a stock is likely to go? For me and many professional traders it’s all in the charts. For those of you that do know what a chart is – it is a collection of stock price movements that are updated every day.
There are many formations found in charts. It’s important to understand the different chart formations that occur, what they mean, and how to use them. Here we will talk about two important formations that indicate buy and sell signals in the marketplace.
Descending Channel Formation
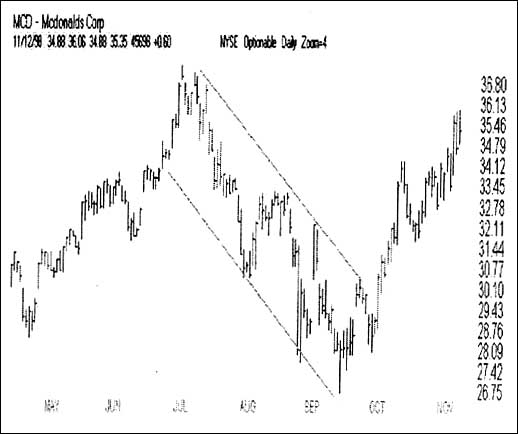
This formation gives an excellent buy signal for investors. The descending channel formation is exactly what the name implies. During a downtrend, investors will come in and buy on the dips; which drives the price of the stock up. In turn, as the stock price goes up, sellers of the stock will come in and drive the stock price down. This will happen several times over a period of time. With each round of buying, the highs formed are lower each time and the lows are lower each time. Volume tends to decline as the channel is formed. Eventually, there are not enough sellers of the stock and buyers come in and take the stock price above the resistance line on higher volume.
Below is a chart showing a classic example of a descending channel formation. You will notice the stock price is trapped between two parallel trend lines. When the stock finally crosses the upper trend line, it will usually move up rapidly for the next month.
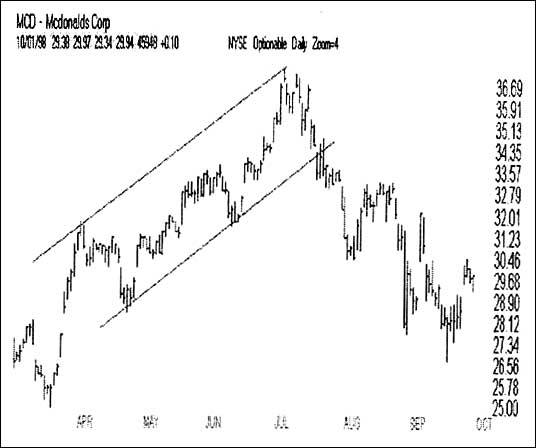
Ascending Channel Formation
This formation gives investors an excellent sell signal. Like the descending channel formation, the stock price is trapped in a struggle between buyers and sellers. The differences from this formation and the descending channel formation are that the ascending channel is an uptrend versus a downtrend. Volume declines as the stock price enters the channel and increases as the stock price breaks the support line.
Below is a chart showing an example of an ascending trend channel. As you can see, after the stock crosses below the bottom trend line, the stock continues to fall for several weeks.