.jpg "TradeWins Publishing")
Follow
Us:    
|
How to Get Rich
Off Trump Market Mania
With ZERO Risk
Imagine getting paid instant cash... and lots of it... any time you want!
The double-dipping secret revealed in this video was discovered by Todd “Bubba” Horwitz, who spent decades as a floor-trader & market-maker.
It’s powerful, foolproof, and surprisingly easy to do.
Go ahead, see for yourself...
Bubba’s Instant Cash Flow
On average, this insider trick pays you 21% instant cash when you enter a trade and often another 100%, 200%, 300% or more when you exit!
You can also get a free copy of Bubba’s eye-opening new eBook... How to Get Rich Off Trump Market Mania With ZERO Risk.
Find out how today...
Click Here Now

|
|
Dan Keen is the publisher of a county newspaper in New Jersey and has been trading online for years. Since the 1970’s he has written hundreds of articles for national computer magazines, as well as several books on computer programming for TAB Books. He taught computer science at Stockton State College in New Jersey. Mr. Keen has written over a dozen books on science topics for both Sterling Publishing and McGraw-Hill Publishers and has taught workshops in online trading.
|
Stunning Breakthrough...
GUARANTEES YOU'LL WIN ON BETTER THAN 9 OUT OF EVERY 10 TRADES
...While Risking Next To Nothing!
You'll know all your trade probabilities and possibilities in advance! You will know... even as you place each trade... that it's virtually a sure-thing winner. That you'll win on more than 90% of your trades!
This powerful strategy has never before been revealed in such easy-to-use, step-by-step rules. Until now, only "Market Wizard" Dan Keen and other experienced, professional traders have taken advantage of...
"CCW: A Low-Risk Cash
Flow Money Machine"
Now you can learn and use this powerful program yourself... and if it doesn't win on at least 9 out of every 10 trades, you'll have it absolutely FREE!
Learn More About
Call Writing: A Low Risk Cash Flow Money Machine
|
|

Better
Business Bureau
|
|
Click on authors name
to learn more
|
| |
|
|
This week Inside Trading brings us Dan Keen. Dan is an expert in covered call writing who outlines some basic options price tables and terminology.
Next, we hear from Lee Gettess as the over twenty-year trader tells us what he expects from the stock and bond markets for the coming week.
Then, Adam Oliensis explains how to measure the flow of money in or out of a security.
Last, Andy Chambers presents his Weekly Market Line in the Sand Newsletter.
Enjoy!
Adrienne LaVigne
TradeWins Publishing
 |
|
Options: Price Tables & Terminology
by
Dan Keen
The following
is an excerpt from Dan Keen's Covered Call Writing: A Low Risk Cash Flow Money
The table below is called an option “class” listing; it is a group of calls or puts on the same stock. Each horizontal row is an option “series”, showing the prices for calls or puts for a particular option having the same strike price and expiration date. This listing is for our hypothetical XYZ Company. The group on the left is information on call options; put options are on the right.
Let’s examine the first row, Dec 10 (XYZ LB-E). The month and the strike price are indicated by “Dec 10”. Don’t be confused thinking “10” is a date – it is the strike price. The day of the month is not given, as it is always the third Friday of the month.
Next, the symbol “XYZ-LB-E” specifies the underlying stock, in this case the XYZ company, “L” is the month (December), and “B” is the strike price ($10). You can find the “L” symbol and the corresponding strike price “B” listed below in the following two tables.
The first three letters of the option symbol will not necessarily be the same as the ticker symbol for the underlying stock. Obviously, some stocks have more than three letters in their ticker symbol, such as those found on the NASDAQ exchange. Sometimes the letter “Q” is also used as an ending character when shortening symbols. For example, the ticker symbol for Staples is SPLS. The June $22.50 call option symbol is PLQFX.
The final letter “E” is not actually a part of the option symbol, but indicates the options exchange where that particular option is traded, such as the New York Stock Exchange, The American Stock Exchange, The Philadelphia Stock Exchange, and so on.
Other columns in a typical option class listing, as seen in the first table above, show the price of the last sale, the bid and ask prices, the volume, and the open interest (the number of option contracts currently held on that specific option).
Options: Price Tables & Terminology
|
Lee
Gettess' Market Sense
by Lee Gettess
Lee
Gettess is a top trader who is excited
to bring you his video newsletter.
Each week, Lee will share his predictions
on what he anticipates from the bond
and S&P markets.
Watch
Video
|
Money Flow Index
by Adam Oliensis
The following
is an excerpt from Adam Oliensis' Stock Chart Analysis & Dynamic Trading System
Money Flow indicators measure the flow of money into or out of a security, based on both volume and rising or falling prices. The particular version of Money Flow we will talk about here is normalized in a way that’s similar to how the Relative Strength Index (RSI) is normalized. Because it measures a specific look-back period (e.g. 14 days), it operates as a kind of volume-weighted momentum oscillator.
In order to make the Money Flow Index (MFI) calculation easier to understand, we have broken it into the following components, shown in the table below.
The “IF, THEN, ELSE” in the equation returns “data 1” if the test is true (non-zero) or “data 2” if the test is false (0). So, for instance, in the phrase, “IF C>=C[-1] THEN 0 ELSE 1” the ordinary English meaning would be, “If today’s close is greater than or equal to yesterday’s Close, then we’ll use “zero”, and otherwise we’ll use “one”. In the calculation of MFI, using this phrase self-selects whether today’s reading is part of NMF or PMF. The self-selection is done by virtue of using the result of the “IF, THEN, ELSE” as a multiplicand in the equation. If the result is “zero”, then the product of the equation is also “zero” and the appropriate NMF or PMF line remains unchanged.
MFI is used in much the same way as is RSI, in that we look for the MFI line to become overbought (oversold), and then we sell (buy) a cross down (up) out of the overbought (oversold) condition.
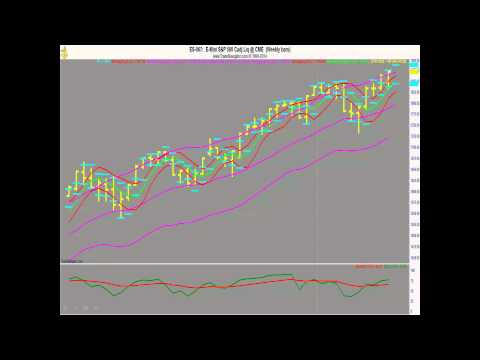
Looking at the chart below, you can see the MFI line is fairly lumpy. It does a good job of giving us an idea of whether the market is overbought or oversold, but its lumpiness makes it hard to measure precisely when you’re getting a good signal.
Money Flow Index
|
Weekly Market Line in the Sand
by Andy Chambers
The following is an excerpt from Andy Chambers' Weekly Market Line in the Sand
Every week Andy publishes his “Weekly Market Line in the Sand” newsletter. The following are trade updates from his most recent issue.
Mini DOW Futures Weekly: The trend is up. The bears have the momentum. The initial hurdle for the bears is seen at 19,607.
QQQ Daily: The trend is up. Tuesday’s big reversal suggests that the momentum is shifting to the bears. We want to exit the QQQ call.
On 9/18 we suggested buying the QQQ January 19th 2018 120 call. The buy price was 8.92. We want to exit the call at the market. The current bid/ask is 14.22/14.82.
To Learn More Click Here
|
|