.jpg "TradeWins Publishing")
Follow
Us:    
|
The Final Turtle Tour Seminar
When: March 17-19, 2017
Where: LAX Embassy Suites, Los Angeles, CA
Who: Russell Sands - One of the Original Turtle Traders
Russell Sands is one of two original Turtle Traders who has permission to teach Richard Dennis’ original Turtle Trading strategies.
Russell has now adapted these same methods to the commodity futures, stock indexes, Forex currencies, options, and ETFs. Now you have the opportunity to learn these same trading methods directly from Russell himself!
Find out more TODAY…
Click Here to Register
This is your last chance to discuss trading tips and advice from Russell Sands one-on-one.
Each day is packed with the Turtle Trading in which you need to help you trade the markets. Russell will be providing his personal trading tips to you, as well as the methodology behind the Turtle System on both Saturday and Sunday.
M4 Members will receive an exclusive discount to attend Russell Sand’s FINAL Turtle Tour Seminar!
Click Here Now: Get your $500 discounted seat!

|

OLIVER L. VELEZ has been an active trader for over 2 decades. He is the founder and CEO of Velez Capital Management, LLC, one of the fastest growing private trading firms in the country.
Mr. Velez has personally trained more than 60,000 traders, individual investors, and institutional investors and has traveled the globe extolling the virtues of trading for a living. He is the co-founder and former CEO of Pristine Capital Holdings, Inc. which he grew into a global brand by serving more than 88,000 traders and investors around the world. Barron’s, Forbes, and Stocks & Commodities have all at one time rated his company the #1 educational trading firm.
Oliver L. Velez has been featured as a trading expert on CNBC, CBS, Bloomberg, and FOX News and in publications including the New York Times, Wall Street Journal, Barron’s, Forbes, and Stocks & Commodities, to name just a few. Dow Jones called him “the messiah of trading.” As a Wall Street “insider,” Mr. Velez has personally mentored some of the nation’s biggest and most successful traders.
|
Oliver Velez –
former Wall Street insider,
best selling author, and internationally
recognized
trader – announces...
SWING TRADING
The Golden Secret of Price,
Time and Market Symmetry
You can know when and where price will turn in every market. Short-term moves and turning points can be pinpointed – absolutely!
Discover the price and time forces which propel and even drive the market each trading day. These forces are nothing less than amazing. There are rhythmical, natural patterns that occur an astounding 80% - 90% of the time in virtually every stock and currency markets’ movements.
In other words, 80%-90% of the time we know where the market is likely to top and bottom. Precisely. Trading with up to 90% plus win rates – as you’ll see inside – is no accident.
This secret – the secret to becoming a millionaire – lies within a powerful and shocking new book and DVD.
Learn More About
Swing Trading
|
|

Better
Business Bureau
|
|
Click on authors name
to learn more
|
| |
|
|
This week Inside Trading brings us Oliver Velez who talks about defining trends in the marketplace.
Then, Lee Gettess shares his weekly video clip covering his bond and S&P market expectations for the week.
Next, George Angell reviews some of the best seasonal trades.
Last, Andy Chambers covers his Weekly Market Line in the Sand newsletter.
Enjoy!
Adrienne LaVigne
TradeWins Publishing
 |
|
The Movement of Stocks
by
Oliver Velez
The following
is an excerpt from Oliver Velez's Swing Trading Home Study Course
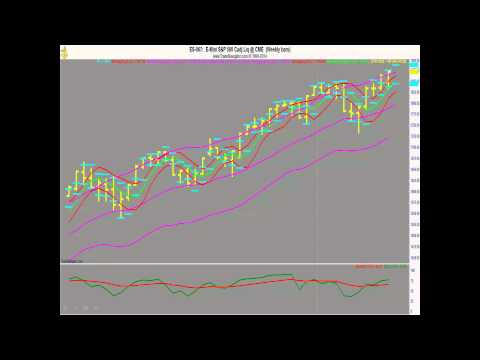
There are only three things a stock can do; go up, go down, or go sideways. That’s it. There is no other movement possible. In other words, there are primarily three dominant trends in the market: uptrends, downtrends, and sideways trends.
An uptrend is defined as follows:
- A series of higher highs and a series of higher lows on the rallies. In other words, each successive rally takes out or supersedes the prior peak from the prior rally. Each drop holds above the low of the prior drop.
- A rising 20- and a rising 40-period moving average. We use simple moving averages based on the close.
- The rising 20- and 40-period moving averages have a consistent distance between them. We call that a “railroad track” appearance. When you have this picture, you have a stock in an uptrend that is completely dominated by the buyers, as shown in the chart below.
The quality of your long trades will vary directly with the quality of the uptrend that the stock is in.
The definition of downtrend is just the reverse:
- A series of lower highs and a series of lower on the sell-offs. In other words, each successive drop takes out or falls below the prior low from the prior decline. Each counter rally falls far short of the high of the prior rally.
- A declining 20- and a declining 40-period moving average, using simple moving averages based on the close.
- The declining 20- and 40-period moving averages have a consistent distance between them. Again, we call that a “railroad track” appearance. When you have this picture, you have a stock in a downtrend that is completely dominated by the sellers.
The stock in the chart below is an example of a downtrend. I want to take a moment to discuss the difference psychologically between uptrends and downtrends. There is a tremendous bias among Americans and new traders especially to be bullish on the stock market. It is important for you to understand that you cannot carry a preconceived bias into the market. You must be willing to adapt and be bullish or bearish depending upon the trend of the timeframe you are playing.
This can be a difficult task for many people, and many people struggle to understand downtrends or bearish strategies. In every case, without exception, the strategy to short a stock is exactly the reverse of the strategy to be long a stock. The decision of which direction to favor must be based totally and impartially on the trend of the chart you are playing.
Third, we have the sideways trend. The sideways trend is defined as a stock having relatively equal highs and relatively equal lows. There is a tug-of-war going on between both groups and neither of the groups is winning. This is demonstrated in the chart below.
The Movement of Stocks
|
Lee
Gettess' Market Sense
by Lee Gettess
Lee
Gettess is a top trader who is excited
to bring you his video newsletter.
Each week, Lee will share his predictions
on what he anticipates from the bond
and S&P markets.
Watch
Video
|
The Best Seasonal Trades
by George Angell
The following
is an excerpt from George Angell's The Money Secret
Seasonal trades are based on the tendency of some markets to rise and fall during specific times during the year. Seasonal trades are easy in the sense that you only need to buy or sell one futures contract – hence, the complexity of the trading is decreased. There are many, many seasonal trend patterns. Moreover, there are key patterns that need to manifest themselves around certain holidays such as the stock market’s tendency to go up just prior to Christmas.
Originally, the notion of seasonal trading was based on the harvesting and processing patterns of agricultural commodities. But, in more recent years, analysts have discovered that even financial instruments demonstrate viable seasonal patterns. While far from a sure-fire method of trading futures contracts, “seasonals” are another weapon in the trader’s arsenal.
Copper
The trading rule is: Buy Copper during January, February or March.
The tendency for Copper prices to rise early in the year is a high as 75 percent, with February being the month most likely to experience a price increase. On a seasonal basis, Copper prices, like so many futures, tend to rise in two distinct legs. The first leg corresponds to the first quarter of the calendar, with profit-taking temporarily pushing prices lower prior to a sustained rally into the late summer and culminating after Labor Day. Thus, for a long-term trade, one in which you might even want to “roll” the Copper position from month-to-month, look to purchase during January and sell after Labor Day during years when this market makes sustained rallies.
Wheat
The trading rule is: Sell wheat early in the year to take profits at the mid-summer lows in July or August.
As a traditional seasonal commodity, wheat tends to decline in price as the harvest season brings large supplies to market in mid-summer. The seasonal tendency for wheat to decline in the winter and early spring into the summer months is almost 75 percent. Another wheat play is try to become a bottom picker during mid July and August when the odds favor a rally in wheat prices into the fall and end of the year. If you are looking for a short-term play in wheat, look to sell July wheat in early April. The probabilities that you will get price erosion into the end of June are quite high.
Best Seasonal Trades
|
Weekly Market Line in the Sand
by Andy Chambers
The following is an excerpt from Andy Chambers' Weekly Market Line in the Sand
Every week Andy publishes his “Weekly Market Line in the Sand” newsletter. The following are trade updates from his most recent issue.
Mini DOW Futures Weekly: Last month’s upside breakout from the six-week trading range points to a further advance. The next target is 22,500. The initial hurdle for the bears is seen at 19,607.
DIA Weekly: Last month’s upside breakout from the six-week trading range points to a further advance. The next targets are 210 and 220. The initial hurdle for the bears is seen at 196.69.
To Learn More Click Here
|
|