
The Movement of Stocks
By: Oliver Velez
The following is an excerpt from Oliver Velez's Swing Trading Home Study Course
There are only three things a stock can do; go up, go down, or go sideways. That’s it. There is no other movement possible. In other words, there are primarily three dominant trends in the market: uptrends, downtrends, and sideways trends.
An uptrend is defined as follows:
- A series of higher highs and a series of higher lows on the rallies. In other words, each successive rally takes out or supersedes the prior peak from the prior rally. Each drop holds above the low of the prior drop.
- A rising 20- and a rising 40-period moving average. We use simple moving averages based on the close.
- The rising 20- and 40-period moving averages have a consistent distance between them. We call that a “railroad track” appearance. When you have this picture, you have a stock in an uptrend that is completely dominated by the buyers, as shown in the chart below.
Uptrend Defined
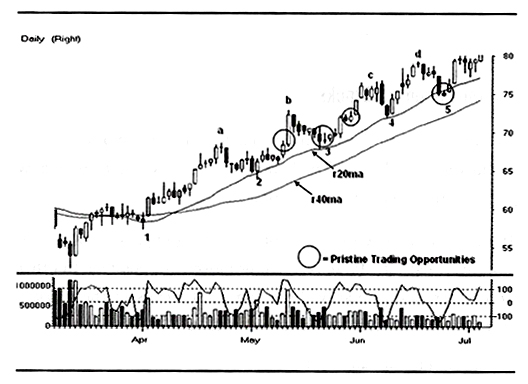
The quality of your long trades will vary directly with the quality of the uptrend that the stock is in.
The definition of downtrend is just the reverse:
- A series of lower highs and a series of lower on the sell-offs. In other words, each successive drop takes out or falls below the prior low from the prior decline. Each counter rally falls far short of the high of the prior rally.
- A declining 20- and a declining 40-period moving average, using simple moving averages based on the close.
- The declining 20- and 40-period moving averages have a consistent distance between them. Again, we call that a “railroad track” appearance. When you have this picture, you have a stock in a downtrend that is completely dominated by the sellers.
The stock in the chart below is an example of a downtrend. I want to take a moment to discuss the difference psychologically between uptrends and downtrends. There is a tremendous bias among Americans and new traders especially to be bullish on the stock market. It is important for you to understand that you cannot carry a preconceived bias into the market. You must be willing to adapt and be bullish or bearish depending upon the trend of the timeframe you are playing.
Downtrend Defined
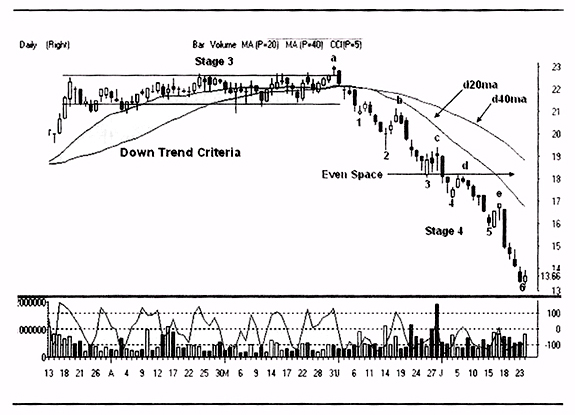
This can be a difficult task for many people, and many people struggle to understand downtrends or bearish strategies. In every case, without exception, the strategy to short a stock is exactly the reverse of the strategy to be long a stock. The decision of which direction to favor must be based totally and impartially on the trend of the chart you are playing.
Third, we have the sideways trend. The sideways trend is defined as a stock having relatively equal highs and relatively equal lows. There is a tug-of-war going on between both groups and neither of the groups is winning. This is demonstrated in the chart below.
Sideways Trend Defined
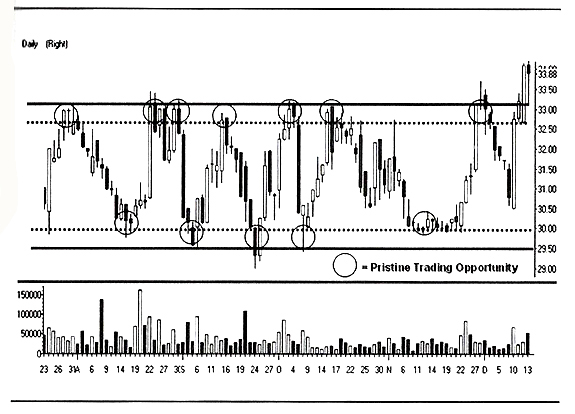
The keyword in that definition is “relatively” equal highs and lows. It is important to understand that these areas of highs and lows are being formed by support and resistance areas. They have to be considered fairly wide areas. We do not react to exact price points, but rather turning points that have been in the area of support and resistance.