.jpg "TradeWins Publishing")
Follow
Us:    
|
You’re Invited to the
Final Turtle Tour
with Russell Sands
When: March 17-19, 2017
Where: LAX Embassy Suites, Los Angeles, CA
Who: Russell Sands - One of the Original Turtle Traders
Russell Sands is one of two original Turtle Traders who has permission to teach Richard Dennis’ original Turtle Trading strategies.
Russell has now adapted these same methods to the Commodity Futures, Stock Indexes, Forex Currencies, Options, and ETFs. Now you have the opportunity to learn these same trading methods directly from Russell himself!
You don’t want to miss
this exciting event...
Click Here to Find Out More
At the Final Turtle Tour seminar, you’ll not only be able to meet the original Turtle Trader, but learn from the original methodology. Each day is packed with the Turtle Trading in which you need to help you trade the markets!
M4 Members will receive an exclusive discount to attend Russell Sand’s FINAL seminar.
Get Your $500 Discounted Seat
Click Here Now

|
|
Growing up in inner-city Detroit, Lee started his career at the very bottom - mopping floors at General Motors. Although being a janitor is honest work, and certainly no disgrace, Lee had a much grander lifestyle in mind.
Believing that more people achieve greater riches in a shorter period of time trading than in any other business in the entire world, he spent every spare minute he had studying the markets. By 1987 his profits provided a sufficient stake for him to quit his job and trade for a living... The rest is history.
|
20-Year Veteran Trader Reveals Secrets Of How To Aim For Over $1,500 A Week When You First Start Trading... Over $6,000 A Week After 1 Year!!
HOW TO STRIVE FOR PROFITS BEYOND YOUR WILDEST DREAMS
Lee Gettess, a veteran of more than 10 years of trading "in the trenches," has written an amazing book that shows how you - or anyone - can aim to make a ton of money trading from home.
I'm not talking about $20,000 or $30,000 a year. I'm talking about $1,500 a week ($75,000 a year) to start... and more than $6,000 a week ($300,000 a year!) within 6-12 months.
Lee knows what he's talking about. About 10 years ago, Lee quit the "rat race" to trade futures for a living. (He hesitates to call it a "full-time" job, because he only spends a half-hour or so a day at it!) Today, futures trading is Lee's only means of income - and he's making more money than ever before!
Learn More About
Trading in the Trenches
|
|

Better
Business Bureau
|
|
Click on authors name
to learn more
|
| |
|
|
Lee Gettess brings us both an article and a video this week. First, he explains buy and sell signals for his VOLPAT trading system. Lee also gives us his up-coming market predictions in Lee Gettess’ Market Sense.
The next article from Darrell Jobman reviews the entry filters used for profitable Turtle trading.
Last, Andy Chambers shares his Weekly Market Line in the Sand newsletter.
Enjoy!
Adrienne LaVigne
TradeWins Publishing
 |
|
VOLPAT Day Trader: Buy and Sell Signals
by
Lee Gettess
The following
is an excerpt from Lee Gettess' Trading in the Trenches
VOLPAT system is a volatility-based recognition system for the S&P 500, plus several patterns traded together. This combination of systems serves to lower the drawdown and thereby enhance profitability. The trades signaled by VOLPAT are mainly all entered on a stop order after receiving an opening price. When you get an opening price range instead of opening price, taking the average of the range will suffice. When the system calls for an open to lower than a certain price the entire range should be lower. If you have the ability to follow the market during the day you have an advantage. You can often enter at a much more favorable price than the system calls for. The market will often trade through VOLPAT’s entry price, then retrace back through it before continuing on. Of course, there are other days when the market charges through the stop price and never looks back. Obviously, by waiting for the retracement you can miss a large move day. Use your own discretion.
In addition to entering at stops, the VOLPAT track record assumes all exits are taken at the close, or with a Market-On-Close (MOC) order. You may find it more profitable to exit a few minutes before the close. Also, those of you following the market intraday may see reasons to exit well before the close. You may indeed outperform the mechanical VOLPAT Day Trader. However, our track record is generated strictly entering on the stop and exiting on the close.
Let’s get to the volatility-based part of VOLPAT. These calculations are done everyday, regardless of what the market did. You will always be using at least one (and possibly both) of the numbers we will calculate, either as your entry point or as a stop-loss order.
We begin by finding the total true range for the last three days. We define this as being HIGHEST HIGH minus the LOWEST CLOSE for the last three day period. However, if the HIGHEST CLOSE minus the LOWEST LOW is a greater number than HIGHEST HIGH minus LOWEST CLOSE, then that is the total true range. True range can be calculated many ways, but this method suits our purposes.
Now that you have your three day total true range, multiply it by .7. If your answer is not exactly a 0 or 5 in the second decimal place (as in 3.37 or 2.41) always round up so that it is. For example, 3.37 would become 3.40 and 2.41 would become 2.45. ALWAYS round up! This new figure will be added and subtracted from yesterdays close to get our initial possible entry points. The CLOSE minus your figure will be a SELL point, and the CLOSE plus your figure will be a BUY point.
VOLPAT Day Trader: Buy and Sell Signals
|
Lee
Gettess' Market Sense
by Lee Gettess
Lee
Gettess is a top trader who is excited
to bring you his video newsletter.
Each week, Lee will share his predictions
on what he anticipates from the bond
and S&P markets.
Watch
Video
|
Filter Your Entry
by Darrell Jobman
The following
is an excerpt from Darrell Jobman's Profitable Trading the Turtle Way
We emphasize that the basic Turtle system is pretty simple and easy to follow, but our entry rules do indicate two additional filters in an attempt to increase our odds of success.
Filter #1: The first filter deals with the general concept that markets move in alternating periods of trending and consolidation, first seeking a new and fair equilibrium price level and remaining there until something new happens to change things. Because of this tendency, we would expect to see a “good” trend followed by some period of sideways consolidation, as opposed to another good trend coming back to back.
Therefore, we use a principle called the “last theoretical trade” or the “last trade loser” rule, also known as the “P/L Filter.” Basically, this says that if the previous trade in a given market was a winner, then you should not take the next breakout that occurs in the opposite direction. Remember, as trend followers, if our last trade was profitable, it was because the market was trending. Our reasoning here is that the next breakout in the other direction will likely fail, and the market will fall back into its old consolidation range rather than establish a newly emerging trend so quickly on the heels of the previous move.
This powerful concept helps to avoid trades that do not offer much chance of profit. In the world of computers, a large number of trades qualify under the breakout rules. For a trade to take all of them is not economically efficient. Many traders may not have sufficient money in their accounts to take every breakout. Even if this is not a problem, it may be difficult to keep track of too many simultaneous trades.
More importantly, taking every breakout is an inferior method of trading. If you could eliminate some trades while not reducing your total profits, you would have a better system. What is better: making $100,000 per year with 100 trades, or making the same amount with 70 trades? Aside from the obvious savings in commissions and execution costs, the second system is more efficient in that it makes more money on a per-trade basis.
Filter Your Entry
|
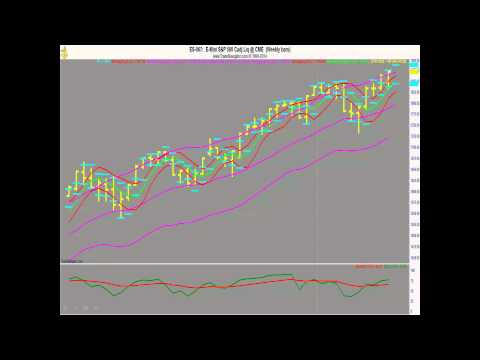
Weekly Market Line in the Sand
by Andy Chambers
The following is an excerpt from Andy Chambers' Weekly Market Line in the Sand
Every week Andy publishes his “Weekly Market Line in the Sand” newsletter. The following are trade updates from his most recent issue.
DOW Futures Weekly: The upside breakout from the six-week trading range points to a further advance. The next target is 22,500. A weekly close below 19,607 would put the bullish outlook on hold.
DIA Weekly: The upside breakout from the six-week trading range points to a further advance. The next targets are 210 and 220. A weekly close below 196.69 would put the bullish outlook on hold.
To Learn More Click Here
|
|