I’m Trading Big-Name Stocks and
Crushing it in This Market Crash
With a 93% Win Rate
■ |
189% - DIA - 3 days |
■ |
129%- DIA - 1 day |
■ |
76% - UVXY - 1 day |
■ |
43% - RCL - 1 day |
■ |
24% - CCL - 1 day |
Using my weekly strategy, you could’ve turned
$10,000 into $206,886 in just 38 months
While others are losing 20-30% on their stocks…
I’m making lightning fast gains.
Every single week… (I’ve averaged 2.1x per week to be exact)…
Big name stocks you know and recognize are moving double... even triple digits in a matter of days.
It doesn’t matter what the market is doing.
It could be up 20%...
Or down 20%...
I’m making money!
Now, that sounds impossible as we’re told most stocks only average 6-8% moves per year.
Plus, we’re in the middle of a stock market crash. For most traders, they’re losing their shirts.
“Volatility is too high to make money.”
Well, that’s not what I’m seeing.
If you know where to look…
You know how to read a chart…
And understand market movements…
You could spot 2X a week, a large brand-name stock about to move and make you a lot of money.
Just during the Feb-March 2020 crash... I had a 92% win rate trading.

If you had started with $700... you could’ve finished
with almost $12,000 in 16 days while
the market crashed.
Take a look:
(and this is over just 16 days)...
Symbol |
Length of trade (days) |
Profit |
Portfolio (start with $700) |
DIA |
3 days |
189% |
$1,325 |
DIA |
1 day |
129% |
$2,385 |
DIA |
4 days |
67% |
$2,935 |
QQQ |
1 day |
-36% |
$2,665 |
UVXY |
1 day |
37% |
$3,987 |
VXX |
1 day |
24% |
$4,733 |
UVXY |
5 days |
28% |
$5,735 |
VXX |
5 days |
17% |
$6,263 |
UVXY |
1 day |
32% |
$7,735 |
UVXY |
1 day |
76% |
$11,181 |
RCL |
1 day |
43% |
$11,466 |
CCL |
1 day |
24% |
$11,556 |
RCL |
5 days |
55% |
$11,916 |
CCL |
5 days |
24% |
$11,921 |
Those are just trading one contract on each trade.
But it also worked when the market was hot as well.
Here’s just a few I’ve spotted recently:
...141% gain from JNJ... which would turn $10,000 into $25,100 (5 days)
...291% gain from AbbVie... which could turn $10,000 into $40,100 (1 day)
...180% gain from 3M... which could turn $10,000 into $29,000 (2 days)
...141% gain from McDonalds... which could turn $10,000 into $25,100 (1 day), and
...228% gain from FedEx... which could turn $10,000 into $23,800 (2 days)
There’s a secret method to locate these plays and I’m going to show you everything today.
And this could be the most profitable page you read this year. Because what would you do if you could turn $10,000 into $25,100 in one day from one opportunity?
I’d think it would be life-changing. Not just for you, but anyone. That’s $15,100 in profits in 24 hours.
If you did that everyday, you’d be worth over $5 million in a year.
Not promising that, but if you can make massive profits like this regularly, you can see how easy it can be to become wealthy.
As a bonus, you’re making your money from rock-solid companies.
Companies like Johnson & Johnson are safe, reliable staples of the average everyday life of Americans.
They’re not going anywhere. They’ll be around for the long haul, meaning you’re safe.
Let others chase risky penny stocks or pot stocks.
Not you.
You’re about to see how safe these big name
stocks are to trade, plus how consistently you can
do this
no matter what the market is doing
For some of the trades you’re getting in and out in just a few days. Sometimes, it’s in just one day.
Take a look...
Over 335 trades I’ve recommended over 38 months, the average duration is 8 days.
Meaning, you get in on Monday, and you’re out the next Monday... on average.
Sometimes it’s shorter.
Here’s a recent run we had in 2020
so you get the idea:
→ We got in on Gilead Sciences (GILD) on Jan 23rd... out in six days on Jan 29th for a 63% gain.
→ We then moved into United Airlines (UAL) on Jan 31st... out in five days on Feb 5th for a 111% gain.
→ We then jump into FedEx (FDX) the same day (Feb 5th)... and we’re out in two days with a 228% gain.
So, in 13 days, you’ve piled up three big winners.
If you started with $10,000… and rolled the profits…
In under two full weeks, you’d be up to an incredible $113,493!
That’s a full 1,134% return on your money starting with just $10,000 in your account.
And the above situation isn’t a fluke.
I’ll show you all the stats from over 38 months of recommending these big movers.
Because every week, there is a stock of a company you know that’s making a big move.
You can choose to buy and hold for a few percentage gains per year…
Or, watch how I turn those two weekly opportunities into massive profits for you and me.
It’s perhaps the fastest profits you’ll ever see
coming from the most unlikely stocks.
If you’ve bought and held stocks for years... and frustrated with the small returns you get (and wasted time)...
Or, you’ve tried your hand at scavenging for your own trading opportunities, only to get burned…
What you’re about to see changes everything about how you buy and sell in the market.
Have you ever seen rapid returns like potentially turning $10,000 into $113,493?
Maybe from penny stocks or the like…
But not from companies that are a backbone of American society like United Airlines.
You can’t 11X your portfolio buying and holding onto stocks.
For example, United Airlines (UAL), from January 2017 to March 2020 was actually down 53%.
Meaning, in over three years, your portfolio would be cut in half.
On the flip side, if you followed my 2.1X average recommendations each week since January 2017, you could’ve turned $10,000 into $206,686 in the same time span.
That includes winners and loser trades (because we all have losers, right?).
That $10k into $206k is a 1,960% total return on investment.
Sounds absolutely impossible... but when you’re pulling down 100-200% gains in a couple days... you can imagine how fast the gains compound.
What’s even more shocking is how this
strategy stacks up against the broad market.
(and working just as well during a bear market)
Over that same 38-month period, the S&P 500 only returned 30%... that’s about 0.78% per month.
For me? I’m averaging 51.5% per month over that time frame…
That’s 65X more profit than if you sat and held onto stocks like all the financial advisors and experts tell us to do.
I’m going to show you a different way.
A better way.
From now on... you’ll have the potential 2X per week to generate incredible profits from some of the largest companies on the planet.
Here’s the kicker…
The key is knowing how to spot those moves.
There’s a secret to doing it.
And if you stick with me to the end...
I’ll show you how to spot the next big mover for just $1.
$1 in exchange for what would’ve generated over $206,886 in your account in just 38 months.
Those are some incredible gains, and I’m betting you haven’t seen many able to replicate this.
Well, today:
- You’re going to see my “snap rubber band” secret to finding these opportunities.
- You’ll have the opportunity to receive up to eight of these recommendations this month for just $1.
- Most importantly, your entire view on trading and investing will be turned on its head when you could be doubling or tripling your money again and again.
There are over 335 trades I recommended
over the 38-month timeframe.
76% of them turned out winners.
But here’s the real clincher.
When it came to profits vs. losses... there was a wide gap.
Because you think “well, you still lost 24% of your trades.”
Well, in terms of raw profit, your winning trades would’ve generated 5X more profit per winning trade vs. the loss from a losing trade.
Here’s what I mean.
Over 335 trades, your winners would’ve produced $256,817 in profit. That’s 255 winning trades so an average profit of $1,004 per winning trade.
Your losers, on the other hand, would’ve only docked $49,231 from your portfolio. Meaning, you’re winning 5X more profit vs. when you lose a trade.
And if you think these numbers are cherry-picked or we had a really good year that balanced the numbers…
Check out the stats for yourself.
|
2017 |
2018 |
2019 |
Total trades |
107 |
120 |
108 |
Winning trades |
80 |
90 |
85 |
Losing trades |
27 |
30 |
23 |
Winning percentage |
75% |
75% |
79% |
Total profit |
$67,636 |
$76,286 |
$62,964 |
Winning profit |
$82,431 |
$95,092 |
$78,594 |
Losses on trades |
-$14,795 |
-$18,806 |
-$15,630 |
Profit-to-Loss ratio |
5.57 |
5.06 |
5.03 |
Take a look closely at all three years.
Notice the consistency across the board in winning percentage (75%, 75%, 79%),
The steady profits ($67k, $76k, $63k), and predictable losses (-$14k, -$18k, -$15k).
You see, you can buy these large company stocks for consistent returns each year.
But this whole time, you could’ve gotten that same consistency with the strategy you’ll discover today.
That’s why...
When you start trading this strategy in the next 8 days,
you’re going to radically transform how you invest.
You’ll feel more confident.
You’ll finally have a strategy you can trust and build a foundation on.
Because going back to this chart above... notice how you’re making money in every market.
In 2018, the market lost 6% as there was a lot of volatility in February and the last four months of the year.
Meanwhile, with my strategy, we logged a consistent 75% win rate and the highest profits while the market cratered.
Then, in 2019, as the market rallied heavily with a run-up of around 26%... I stayed the course.
I logged a 79% win and similar high winning profits as the 2018 down year.
So I leave it up to you…
Does this look like a strategy that could radically add thousands, tens of thousands, even hundreds of thousands of dollars into your account as I showed you.
The track record is there…
The key is knowing how to spot these opportunities. That’s what I’m going to show you...
The secret to finding these opportunities starts
with my “snapback rubber band” secret.
I’ve rarely shared this before, but it’ll help you identify which big-name stocks are about to make massive moves.
Take a look…
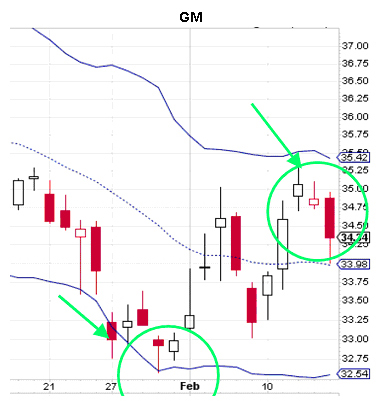
Everytime one of our big name stocks hits the bottom of our ‘band’... they snap back like they got zapped by an electric fence.
See here…
GM trade... in and out in 14 days... 56% gain.
Watch the snap back.
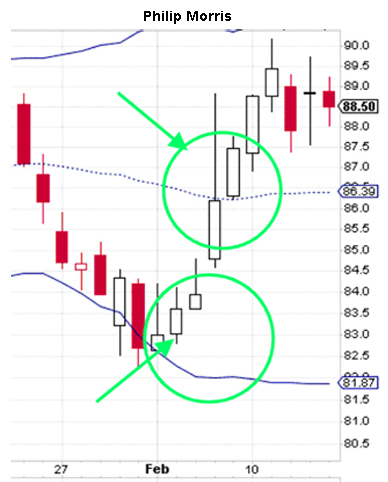
Again here…
Philip Morris... the cigarette guys... in and out in 1 day.
Also here…
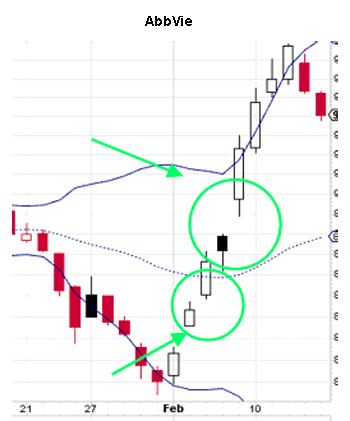
AbbVie, two day trade, that netted 102%.
Just follow the snap back.
When the stock hits that bottom and starts moving back up…
Get in.
It happens again and again.
Stock hits band…
Then jumps away from it.
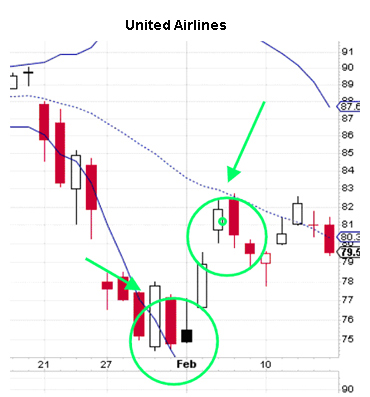
United Airlines winner here.
Here it is again.
This was a Deere & Co trade that generated 75% in 4 days.
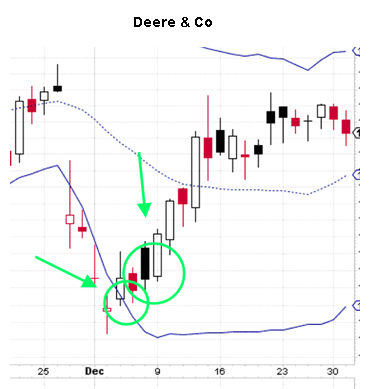
If we had held on, it would’ve been a 400%+ winner.
But we’re happy to follow the process and collect the profits. I’m not mad about it.
I just follow the same ‘snapback rubber band’ indicator again and again.
Here’s some more for you.
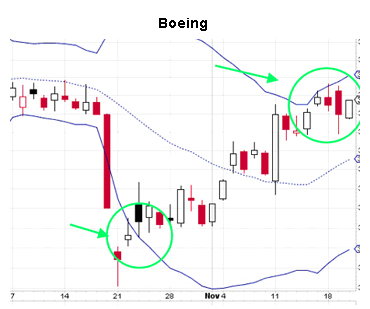
Boeing... this was a 12 day trade... so a little longer, but a nice 82% gain. Perfect timing getting in.
And one more time…
That’s a Chevron winner. 73% in 15 days. Not bad.
Now, here’s where the rubber band meets the road.
If we can lean on this ‘snapback rubber band’ indicator up to 79% of the time as I did in 2019... it doesn’t make sense for us to shell out potentially tens of thousands of dollars to buy the stock... and then watch it go up 3-4%.
Even if you poured $50,000 into our big-name stock... you’re only profiting around $1,500.
That’s a huge risk to take for little reward.
Since you know you can win ¾ times,
plus profit 5X more profit than you
would on a losing trade...
it makes sense to leverage up.
The way I leverage up is simple.
I’m buying call and put options.
If you’ve never bought calls and puts before... it’s very similar to buying and selling stock. You choose the quantity you want to buy and you hit ‘trade.’
Using options, I’m able to 10X the return possibilities vs. just buying the stock outright.
Maybe you’ve dabbled in options before and lost money…
Or, you feel they’re too complicated…
I’m going to give you the step-by-step process on how to start making money with my strategy.
Options are my go-to weapon.
And it’s been that way for decades.

Hi, my name is Ian Cooper.
For over 20 years I’ve been in the markets... working diligently day-in and day-out to learn the very best options strategies.
You won’t find me on CNBC everyday jabbering about the markets…
Instead, I spend my time at my desk spotting how to make 6-figures off the news cycle. I take what they promote and turn it into trade opportunities.
Combined with that skill set I’ve mastered technical analysis to read a chart and figure out where a stock is going to move next.
That’s how I came across my ‘snapback rubber band’ indicator.
I work tirelessly to build a set of rules for you to easily follow and implement without getting sucked into the noise of the media.
With that said...
Let me be 100% clear…
These skills of technical analysis and building options strategies take years and years of trial and error, learning from others, and - frankly - losing money.
You’re being given the opportunity right now to fast forward years and years of trial and error. For me, that time was over 20 years from the start of my career to now where I land triple digit profits regularly like clockwork.
Meaning, you bypass the decades of long nights and stressfully tight financial times I went through…
All because I want you to be a successful trader. There’s too much junk out there today especially when it comes to options.
I decided to take the bold step, approach my publisher, and offer to give away my entire strategy and multiple weekly recommendations to you for just $1.
If you’re still on the fence…
Maybe you see the potential in the strategy…
But you aren’t sure about me yet.
Well, let me tell you:
Over the last 20 years,
I was one of the few that called:
- The bottom and top of the housing market before the Great Recession,
- The top of subprime mortgages,
- The death of Lehman Brothers and Bear Stearns,
- The collapse of the UK economy and
- The Dow’s collapse to 6,500, including its recovery.
I even forecasted gold to rally above $1,000 when it was trading under $850.
These are big predictions that put my name and reputation on the line. Yet, I didn’t stop there.
Called Netflix at $10!
Recommended Google after IPO!
Through the years, I’ve had some big stock pick winners:
- I recommended a buy on InterOil (IOC) at $20 a share. It would run to $400 -- a 1,900% return.
- I recommended a buy on Visa (V) at $18. At $125 a share, it returned over 594% returns.
- I recommended a buy on Google (GOOG) shortly after IPO and watched it race above $1,000 for gains of up to 567%.
- One of my proudest recommendations -- Netflix at $10 -- raced 4,000% higher.
None of this was meant to brag. Again, you won’t see me on TV much, even with this strong of a track record.
I’m not here for the fame or attention.
I’m doing well in the markets, and I believe in paying it forward.
Today, I’m willing to show you how I uncover
multiple triple digit winners every week
using our big-name stocks.
Like I said, I specialize in options because we want to take advantage of leverage to turn meager 3% gains into 100%+ gains.
It’s not gambling…
It’s not luck…
It’s simply following years and years of my hard work.
Every week, there are at least two big-name stocks moving, and you could be profiting from them.
Here’s the best part... and another ding against buying and holding stocks…
We can make money going up or down!
You’ve seen a lot of recommendations I made going up…
But what about when a stock is going down... is there a potential way to make money?
Sure. But rather than shorting a stock and taking unlimited risk…
I instead buy a put... which increases in value when the underlying stock goes down... and I make much more.
In 2018, right before the markets dropped in February, I put on a few put recommendations to my subscribers:
- On Jan 24th - United Airlines put for $3.03
- On Jan 26th - Starbucks put for $2.43
- On Feb 1st - UPS put for $2.01
Well, if you remember, stocks dropped 10% over the next two months.
My trades:
- United Airlines = 62% gain in 2 days
- Starbucks = 71% in 6 days
- UPS = 94% in 1 day
But those weren’t the only stocks I called that would drop…
I also took advantage of drops in these stocks:
- 168% gain in 3 days - Western Digital
- 141% gain in 3 days - Nvidia
- 76% gain in 1 day - Coca-Cola
- 164% gain in 1 day - Lowes
- 110% gain in 1 day - CSX
Much like the calls I recommended to buy... puts are the same way.
See how fast these gains are happening...
All within a week.
I average hold times of 8 days... but sometimes you hit it out of the park and double... close to triple your money in as little as one day.
Make money going up... make money while stocks go down.
It’s the best of both worlds.
How I’m uncovering these plays is using
my snapback rubber band strategy.
Here’s how it works.
The thought behind it is easy to visualize.
Imagine you’re holding a rubber band and you stretch it as far as it can go. You keep pulling and pulling.
Guess what happens next…
Well, you probably did this in elementary school...
If you let go of any side of the band... it’ll snap back at a lightning fast pace. All that pent-up energy built into the rubber band releases to shoot the band forward.
Taking this idea, the same scenario plays out in the markets.
Stocks don't go up or down forever. They move in waves.
As we saw in 2018 and 2020, stocks were overstretched to the upside... and then they snapped back into correction and bear markets.
After the 10% correction in 2018, stocks snapped back and soared in 2019 at a blinding pace. Up 26% for the year.
Then, it stretched to the upside too far and snapped back in early 2020.
The phenomenon plays out every week. History repeats itself, as they say.
Take a look at the rubber band in action.
I teased it before.
See here…
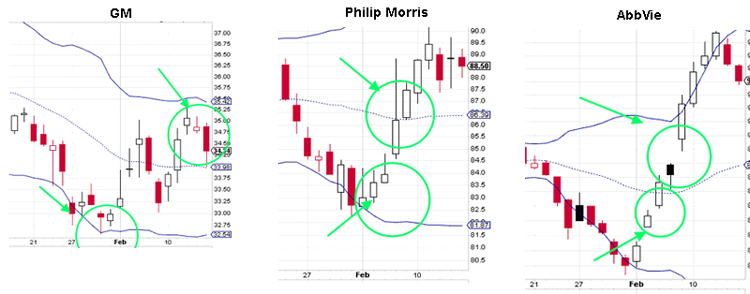
Hits bottom... snaps up. Hits bottom again, snaps up.
Take a look at the left side of each of these charts.
Notice they were all dropping at a rapid rate before they snapped back up.
Look at the top and bottom black lines. Those lines measure volatility in the stock. The more they stretch apart, the more volatility in the stock.
Think of the stretch as the built-up energy in a rubber band.
Well, much like a rubber band, the more they stretch, the faster they will pull back and make you money.
We then buy a call or a put and take advantage of the stock running up in the other direction.
Take a look again with my United Airlines play.
The stock craters 15%... once the ‘snapback’ occurs, we pile in.
Look at another.
This was a Deere & Co trade that generated 75% in 4 days.
Stock gapped down multiple times... the band stretches... at some point it will break... and it does.
It swings back up wildly… and we take advantage.
While others are waiting for it to drop more, or they buy at the first gap down... we’re waiting for that snapback.
I just follow the same ‘snapback rubber band’ indicator again and again.
Here’s Boeing with a large drop as you can see from the long red bar.
Was it going to keep dropping?
Some said yes. We knew the snapback was coming, and we entered the trade as it swung upwards again.
The stock rallied right back in a few weeks after the drops. We profited.
And one more time with the rubber band example…
Our Chevron call was perfect as it snapped right back after a big drop, and we rode it up with our call option.
Over 355 trades, this snapback rubber band strategy has proved consistent again and again.
Take a look at all our trades.
That’s 38 months of recommendations. From corrections to bullish markets... this strategy works!
You’ve seen how the ‘snapback rubber band’ strategy allows us to identify a big-name stock that is making a big-time move so we can profit.
But there’s more to this strategy…
More that I don’t have time to share with you today.
Because with trading, there are a lot of decisions you have to make on the fly.
With options... it’s important you’re making the correct decision... so you can leverage the right stock for the largest profit…
With options you need to know with certainty:
- The stock is making a ‘real’ move up and not a fake move that reverses back the other way.
- When you should take the profits and close the trade so the trade doesn’t turn against you.
- Multiple indicators are giving you non-conflicting signals... i.e. ‘Buy the call or put.’
With our rubber band indicator, we get a good signal that a stock is prepping for a snapback.
That’s not the full story, though.
The strategy doesn’t give us the signal when’s the best time to sell our position nor if the stock could reverse on us.
That’s why I have three
more indicators I use:
- Find the stock
- Verify the stock is about to make a big reversal move
- Know the right day to execute the trade
- Determine the best close date
This rubberband mechanism you just saw is a perfect jumping off point for my weekly trading strategy.
You can take it and go trade with calls and puts... and I think you’ll do okay.
But, I have THREE other indicators I combine with the rubber band strategy to double, triple, quadruple check that the stock is going to move where you think it will.
Those three indicators I’ve housed
inside a brand-new (free) special report,
Trigger Point Playbook.
- All FOUR indicators that trigger which big name stocks could be moving this week.
- How to make money from the news no matter what the headlines say.
- Where to set up your own indicators (for free) to find trading opportunities every day.
...and much more.
The triggers are my rubber band indicator plus
the other three I’ll show you. These four indicators
combine to triggeran alert for a stock about to move.
Combined... you can win up to 93% of the time as I’m doing during the crash.
This report is valued at $49... but I’m going to give it to you for free because it’s key information for spotting the big-name stocks about to move.
To claim your report, make sure you read to the very end.
Like I promised, I want you to experience some big winners this month…
I spent 20 years learning the craft. It took a lot of restless nights... and a lot of money and time... but I’ve perfected my strategy.
You can go off and try and learn it all yourself.
You can spend years tinkering with multiple indicators…
You can spend thousands... even tens of thousands of dollars working on developing your own strategy.
I don’t know about you... but reinventing the wheel isn’t how I want to spend my time.
I’d rather be with my family, traveling, and making money with a proven strategy already in place.
The choice is yours.
You can learn how to trade my weekly strategy yourself.
Why would you though?
I’m giving you my Trigger Point Playbook for free…
Plus, as I’ve said all along... for just $1... you get my trade recommendations.
You can only get my trade recommendations
for $1 inside my weekly trading system,
Trigger Point Trade Alerts.
This is your personal invitation to join. Click Here Now
Here’s what you get as a member of
Trigger Point Trade Alerts:
- Up to every trading day (Monday - Friday unless a holiday) you get a stock or option trading recommendation. These are trades you can make inside any brokerage account. They have the potential to shoot up 228% in 2 days like a recent FedEx play. Some recommendations may be to sell and lock in profits.
- Get exclusive access to archived and open trades to track the best trades for you. See my track record with your own eyes.
- Unlimited email access to myself. I have a private Yahoo.com address I use for your questions and comments. I cannot provide personalized investment advice, however, I’m always happy to get caught up in stock talk.
This is a $2,000 value…
And for 30-days of access to Trigger Point Trade Alerts… all you owe today is a measly $1.
Why only $1 for $2,000 value?
This is a new product and I want to get as many users as possible in the door to see the power of my strategy. Plus, I also need to gather testimonials after you’ve hit some big winners yourself.
Many options trading services go for
$3,000 - $6,000 dollars per year.
Not this one.
I racked my brain on this pricing... after all there is so much potential in these trades...
I mean, this service could easily go for $5,000…
After all, the winning trades average $1,004 in profit... and you get 4-8 trades per month.
You could pay off your subscription in week one.
Still, for this special launch, I went with a special price.
It’s the lowest price you could charge for a service.
And I want to keep it that low so you have zero risk to join me.
So, on this page only, you can start a 30-day subscription to Trigger Point Trade Alerts for just $1.
After 30 days, you’ll be charged a regular $39/month going forward.
If after 30 days, you don’t feel this service is right for you, simply give us a call and you won’t be charged another penny.
Let me sum it up.
You get $2,049 of value for $1.
This is one of the best deals on an options service you’ll ever find. And I’d put my track record up against any other service.
With it comes a guarantee.
A guarantee you’ll make 1000X back
your investment today in the first 30 days.
Once you get inside the service and see how much money you’ve been missing out on, I believe you’ll want to stay with me for the long haul.
That’s why I’m willing to guarantee you’ll make 1000X back your investment or you get a month of the service for free on me.
With just a $1 investment today, you’ll have the opportunity to make massive profits from big-name stocks starting this week.
You’ve seen the track record…
- Consistent 75-79% win rates
- The past chance to turn $10,000 into $206,686
(that includes winners and losers)
- Our average days in a trade is only 8 days
This is a fast-paced, exciting service.
This might be the most important strategy
to use during a market crash
Click Here to check out my track record again during the first 16 days of the Feb-March 2020 market crash.
Others were losing 20-30% in their stock portfolio.
The stock market lost $11.5 trillion in the first 9 days of the crash…
Meanwhile, myself and my subscribers are making money hand over fist while the rest of the market burns.
- Options are cheaper than buying stock…
- You can make more money faster…
- And it’s easier to compound for faster profits during this rough time.
You need cash now more than ever before.
Stop trying to time the market and buy stocks.
Follow my strategy instead.
The very first trade could double your money in as little as 1-2 days. Doesn’t matter if the market is going up or down, you can take advantage of it.
Join me as one of the first inside Trigger Point Trade Alerts.
Put in your information below and start now.
Ian Cooper
Founder of Trigger Point Trade Alerts
P.S. As you’ve seen in the current markets from 2018 - 2020 and beyond, buying and holding stocks could result in making almost nothing. That’s wasted time and money from not compounding your money. Meanwhile, I’m trading when markets are down (2018) and up (2019) and down again (2020) and keeping a consistent win rate and profit ratio.
If you feel stuck by the current market conditions, do something for yourself. For just $1, you can unlock an entirely new way to make money in the markets. Again, do this for yourself.
I only ask that if you do join Trigger Point Trade Alerts, you make a pledge to trade at least 2-4x of the recommendations each month. That’s how you get better as a trader... plus, it’s the only way to make money.
Join me now and put in your credit card information below.
© 2021 Tradewins Publishing. All rights reserved.
The information provided by the newsletters, trading, training and educational products related to various markets (collectively referred to as the “Services”) is not customized or personalized to any particular risk profile or tolerance. Nor is the information published by Ian Cooper a customized or personalized recommendation to buy, sell, hold, or invest in particular financial products. Past performance is not necessarily indicative of future results. Trading and investing involve substantial risk and is not appropriate for everyone. The actual profit results presented here may vary with the actual profit results presented in other Ian Cooper publications due to the different strategies and time frames presented in other publications. Trading on margin carries a high level of risk, and may not be suitable for all investors. Other than the refund policy detailed elsewhere, Ian Cooper does not make any guarantee or other promise as to any results that may be obtained from using the Services. Ian Cooper disclaims any and all liability for any investment or trading loss sustained by a subscriber. You should trade or invest only “risk capital” – money you can afford to lose. Trading stocks and stock options involves high risk and you can lose the entire principal amount invested or more. There is no guarantee that systems, indicators, or trading signals will result in profits or that they will not produce losses.
Some profit examples are based on hypothetical or simulated trading. This means the trades are not actual trades and instead are hypothetical trades based on real market prices at the time the recommendation is disseminated. No actual money is invested, nor are any trades executed. Hypothetical or simulated performance is not necessarily indicative of future results. Hypothetical performance results have many inherent limitations, some of which are described below. Also, the hypothetical results do not include the costs of subscriptions, commissions, or other fees. Because the trades underlying these examples have not actually been executed, the results may understate or overstate the impact of certain market factors, such as lack of liquidity. Ian Cooper makes no representations or warranties that any account will or is likely to achieve profits similar to those shown. No representation is being made that you will achieve profits or the same results as any person providing a testimonial. No representation is being made that any person providing a testimonial is likely to continue to experience profitable trading after the date on which the testimonial was provided, and in fact the person providing the testimonial may have subsequently experienced losses. Ian Cooper ‘s experiences are not typical. Ian Cooper is an experienced investor and your results will vary depending on risk tolerance, amount of risk capital utilized, size of trading position, willingness to follow the rules and other factors