
Scanning for Wedge Patterns
By: Rob Roy
The following is an excerpt from Rob Roy's Option Axiom Rules Trading Course
No one gets into trading to have to work a second full-time job. You get into trading to make more money. Don’t be fooled. Learning to trade properly can take time and hard work. Once the skill set has been developed the actual application time for trading is small. A trader can find wedge patterns easily enough by looking through chart after chart. The problem is that there are over 3,800 optionable stocks. No one in their right mind wants to look at that many charts each day to find a trade set up. Traders want to use either broker platforms or scanning software to reduce the amount of charts to review each day to as few as possible. The key is they have to identify the right criteria to reduce the number of charts significantly, while capturing the best charts.
There is an indicator known as the Average Directional Index (ADX). There are many ways to use this indicator potentially to trade. Each broker platform or scanning software will have different ways to set up, scan, read, and use the ADX. We will talk about one simple way to use it, and the criteria you can set into the tool of your choice.
The ADX is coupled with the Directional Movement Index (DMI) in most platforms and software. The DMI can be a powerful tool as well for trading, but not necessarily for this technique. To best understand what the ADX is expressing, we will include a brief explanation of the DMI as well. However, this is not all there is to these indicators! There is much more to using these indicators. We are merely covering what is relevant to finding our wedge patterns.
The image below is a stock
chart with the ADX and the DMI placed below it. The way to read this indicator
is straight forward, yet takes a little getting used to. If the positive
DMI is above the negative DMI that shows that the bullish trend is in
control. The ADX rising and falling indicates the strengthening or weakening
of the overall trend.
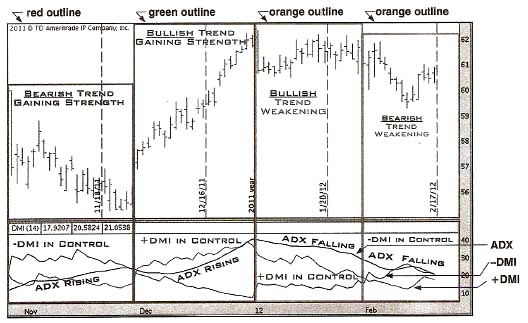
In the red outlined section of the chart, the negative DMI is above the positive DMI, which shows that the bearish trend is in control. The ADX is rising indicating that the trend, in this case bearish, is gaining strength. In the next section of the chart, in the green outline, the trend in control changes. The positive DMI crosses over the negative DMI indicating that the bullish trend has taken control. The ADX continues to rise, showing that the trend, now turned bullish, is gaining strength.
In the third section of the chart outlined in orange, the positive DMI is still above the negative DMI indicating that the bullish trend is still in control. The ADX however has started to decline. The declining ADX shows that the bullish trend is getting weaker.
In the final section of the chart also outlined in orange, the negative DMI has crossed back above the positive DMI; the bearish trend had taken back control. The ADX continues to drop, showing that the overall trend is getting weaker.
To recap: if either the positive or negative DMI is on top of the other; that shows which trend is in control. What we are more interested in for our Axiom Strangles is where the ADX is, showing how strong or weak the trend is. True wedge patterns by nature show a very weak trend as the stock consolidates with no clear direction. Stocks that are in true wedge patterns will usually have a very low ADX reading.
A low ADX, meaning no clear trend, would be a reading below 15 on the chart. With that in mind, using any technical indicator is a two-step process at minimum. All stocks trade slightly different as they have their own “personality”. First, are the criteria for the indicator ADX below 15? The second criteria is to refine the indicator to the individual stock to see how that stock typically responds to the indicator. On some stocks an ADX of 15 is typically the lowest you will see on the chart. On other stocks however, an ADX of 8 can be the lowest reading on the chart. This can be used for timing the entry of the trade.
Before a trader can refine the ADX reading to the individual stock, they need a list of stocks with an ADX below 15. The major criteria for this scan would be:
- ADX below 15
- Daily average stock volume greater than 300,000
- Stock price over $20.00 per share
Let’s dig deeper into these points. We seek an ADX below 15 so the trader knows the overall trend is weak on the stock. Not every stock with an ADX below 15 will have a wedge pattern. In fact, most of them will not. This a refining process, and having to look through a couple dozen stock charts each day does not take but a few minutes once you have spent some time learning what you are seeking.
The minimum daily average stock volume of greater than 300,000 helps to make sure the trader is looking at stocks that trade enough volume. Having enough volume will make it easier to get in and out of the trade. Typically, most option traders are looking at trading stocks that have a daily average stock volume over 1,000,000 shares per day or more. However, it is typical for a stock to trade less than its normal average volume when consolidating. Part of the consolidation process and weakening of the trend, is that the stock currently has less interest from traders, therefore less trades or volume is being made. The criteria of the stock price trading over $20.00 per share are to make sure the stock trades high enough to have enough room to move. These particular criteria may change depending on your account size.
After the trader has run the
scan, they must then sort through the results to find only the cleanest
chart setups that have options with the best possible edge in them. The
key to trading is not quantity, but quality. To gain this ability, it
will take looking through many charts, back testing, forward testing,
paper trading, real trading and some good old-fashioned hard work. The
payoffs, however, can be very lucrative.