
Elliott Wave Analysis
By: Murray Ruggiero
The following is an excerpt from Murray Ruggiero's Cybernetic Trading Strategies
Elliott Wave analysis is based on the work of R.N. Elliott during the 1930’s. Elliott believed that the movements of the markets follow given patterns and relationships based on human psychology. Elliott Wave analysis is a complex subject and has been discussed in detail in many books and articles. Here, we will not go into it in great detail, but will provide an overview so that you can understand why I think Elliott Wave analysis is predictive.
Elliott Wave theory is based on the premise that markets will move in ratios and patterns that reflect human nature. The classic Elliott Wave pattern consists of two different types of waves: A five-wave sequence called an impulse wave, and a three-wave sequence called a corrective wave.
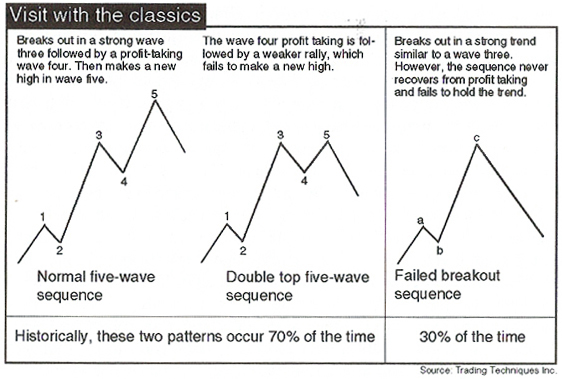
The classic five-wave patterns and the three-wave corrective wave are shown below. Normally, but not always, the market will move in a corrective wave after a five-wave move in the other direction.
Let’s analyze a classic five-wave sequence to the upside. Usually, wave one is a weak rally with only a few traders participating. When wave one is over, the market sells off; creating wave two. Wave two ends when the market fails to make new lows and retraces at least 50 percent, but less than 100 percent, of wave one. Wave two is often identified on a chart by a double-top or head-and-shoulders pattern. After this correction, the market will begin to rally again – slowly at first, but then accelerating as it takes out the top of wave one. This is the start of wave three. As another sign of wave three, the market will gap in the direction of the trend. Commercial traders begin building their long position when the market fails to make new lows. They continue to build this position during wave three as the market continues to accelerate. One of the Elliott Wave rules is that wave three cannot be the shortest wave and is, in fact, normally at least 1.618 times longer than wave one. This 1.618 number was not selected out of thin air. It is one of the Fibonacci numbers – a numerical sequence that occurs often in nature. In fact, many of the rules of Elliott Wave relate to Fibonacci numbers.
At some point, profit taking will set in and the market will sell off. This is called wave four. There are two types of wave four: simple and complex. The type of wave four to expect is related to the type of wave two that occurred. If wave two was simple, wave four will be complex. If wave two was complex, wave four will be simple. After the wave-four correction, the market rallies and usually makes new highs, but the rally is fueled by small trades and lacks the momentum of a wave-three rally. This lack of momentum, as prices rally to new highs or fall to new lows, creates divergence using classic technical indicators. After the five waves are finished, the market should change trend. This trend change will be either corrective or the start of a new five-wave pattern. The mirror image of this pattern exists for a five-wave move to the downside.
Elliott Wave patterns exist on each time frame, and the waves relate to each other the same way. For example, a five-wave pattern can be found on a monthly, weekly, daily, or intraday chart. You must be in the same wave sequence in each time frame. In other words, in a five-wave downward pattern, you would be in a wave four in a monthly or weekly time frame, and in a wave three to the upside on a daily or intraday time frame.
When you study an Elliott Wave pattern closely, you will see that each wave is made up of similar patterns. Many times, in a five-wave pattern, wave one, or three, or five will break down additional five-wave patterns. This is called an extension.
Types of Five-Wave Patterns
The three possible five-wave patterns have been shown in the picture above. The first two are the classic five-wave sequence and the double-top market. The mirror image of these patterns exists on the downside, and these two patterns account for 70 percent of all possible historical cases. Finally, when the market fails to hold its trend and the trend reverses, we have a failed breakout sequence pattern. The first two five-wave patterns consist of a large rally; then consolidation occurs, followed by a rally that tests the old highs or sets new ones. The failed breakout pattern occurs 30 percent of the time and is unpredictable.
We can trade the basic five-wave pattern as follows:
- Enter wave three in the direction of the trend.
- Stay out of the market during wave four.
- Enter the wave-five rally in the direction of the trend.
- Take a countertrend trade at the top of wave five.
Trading the five-wave pattern sounds easy, but the problem is that the current wave count depends on the time frame being analyzed. For example, if we identify a wave three on both the weekly and daily charts, we have a low-risk, high-profit trading opportunity. If we are in a five-wave downward sequence on a weekly chart but a wave-three upward pattern on a daily chart, the trade would be a high-risk trade that may not be worth taking. When trading Elliott Waves, it is important to view the count on multiple time frames.