.jpg "TradeWins Publishing")
Follow
Us:    
|
|
|
Gary Wagner is the co-founder of International Pacific Trading Co. in San Clemente, CA. He is also the co-author of the book, Trading Applications of Japanese Candlestick Charts and co-developer of the software program, The Candlestick Forecaster, using artificial intelligence and computerized pattern recognition. Gary is a registered commodity broker and a CTA with more than 10 years of trading experience.
 |
Imagine The Profits If...
How much money could you make if you had the ability to instantly identify market turning points days in advance?
Amazingly, you can do just that with the information you will learn in Gary Wagner's revolutionary new trading course.
Learn More About
This Great Opportunity
World's Most Powerful Charting Secret
|
|

Better
Business Bureau
|
|
Click on authors name
to learn more
|
| |
|
|
This week Inside Trading features Gary Wagner. Gary explains how the ‘Three New Line Price Break’ style of charting is very effective for stocks or commodities.
Then, Ken Chow brings us a video where he talks about using bar charts to confirm trends.
Next, Market Publications shares how technical analysis is best used in the foreign exchange market.
Last, Wendy Kirkland offers her Prime Entry Profits (PEP) Rally Newsletter.
Enjoy!
Adrienne LaVigne
TradeWins Publishing
 |
|
Candlesticks: Three Line New Price Break
by
Gary Wagner
The following
is an excerpt from Gary Wagner's Candlesticks: Three Line New Price Break
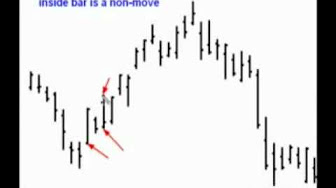
The “Three New Line Price Break” chart is a variation of the standard candlestick chart and is very similar to the “Point and Figure” chart. The purpose of this chart is to assist in eliminating the potential short term reversal signals that are common on a “Daily Candlestick” chart. This type of chart was developed to be easy to understand and use by generating few signals with a much higher probability of success.
Three Line New Price Break
|
Using Bar Charts to Analyze Trend
by Ken Chow
In this excerpt Ken Chow discusses how to use bar charts to confirm trends.
Watch
Video
|
Why is the Foreign Exchange Market the Best Market to Use Technical Analysis?
by Market Publications
The following is an excerpt from Market Publications’ The Beginner’s Guide to Success in Today’s Amazing FX Currency Markets
The foundation behind using technical analysis is to find trends when they first develop, which allows the trader to ride the trend until it ends. The foreign exchange market is typically composed of trends and is, therefore, a place where technical analysis can be effective. Traders are able to speculate on both up and down trends in the foreign exchange market because it is possible to buy a currency and sell against another currency. This aspect of currency trading works well with technical analysis, because technical analysis helps determine where the trends are and which way they are going, thus giving the trader a chance of profiting from the market, regardless of its direction.
The Best Market to Use Technical Analysis
|
Prime Entry Profits (PEP)
by Wendy Kirkland
The following is an excerpt from Wendy Kirkland’s Prime Entry Profits
Every day Wendy shares her “Prime Entry Profits” (PEP) Rally Newsletter. The following is her thought for the week, along with what she expects this week in trading.
PEP- Thought for the Week: With the New Year at hand consider the idea that - Whatever feelings you have within you are attracting your tomorrow. Worry attracts more worry. Anxiety attracts more anxiety. Unhappiness attracts more unhappiness.
AND... Joy attracts more joy. Happiness attracts more happiness. Peace attracts more peace.
Your job is an inside one. To change your world, all you have to do is change the way you feel inside. How easy is that?
Today: The illusive DOW 20k came as close as 20 points soon after open and then went flat for the balance of the day . The other indices held modest gains. The Nasdaq was the percentage leader as it moved into area of new high.
To Learn More Click Here
|
|