.jpg "TradeWins Publishing")
Follow
Us:    
|
Last Chance:
Complementary Automatic Income
THERE WILL BE NO SECOND CHANCES
Please DO NOT miss your LAST CHANCE to get your free Automatic Weekly Income Course from Int’l Live Trading Champion, Chuck Hughes.
The Automatic Income Method revealed in Chuck’s Weekly Cash Blueprint has earned Chuck Hughes 8 First-Place trophies in prestigious Int’l Live Trading Championships... proving that this strategy outperforms other strategies hands down!
Before it's too late...
Click Here Now
Download your Automatic Weekly Cash Blueprint for FREE... Watch the video and discover how to make every trade an instant winner!
Find out how you can earn 1 full year’s income for FREE!
Automatic Weekly Cash
[pdf & video]
Please don’t underestimate this amazing gift you’re about to receive. Hopefully you’re not too late...
FREE Weekly Cash Blueprint
1 Year FREE Income

|
|
Adam Oliensis is editor of the trading service The Agile Trader. He has been a full-time independent trader, investor, technician, and editor since 1997. Oliensis was chief trader for 21st Century Alert’s Single-Stock Futures service. He has been a regular contributor to numerous financial websites over the past 10 years including: Realmoney.com, 21st Century Alert, Bullmarket.com, Rightside Advisors, and Superstock Investor.
Adam got started in the markets early, at age 9, investing $44 in a share of ADP. He later sold his original investment for a profit of $1,364. In the 1990s, he became an active technical analyst and trader, and launched his first options service.
|
Former “Law and Order” actor, computer geek, and master technical trader Adam Oliensis reveals how you can...
Become Almost 27X Richer in Today’s Market – Even as Other Investors Panic and Lose It All!
Are you sick and tired of watching the news every night to see how much the Dow lost that day?
Has your portfolio taken such a hit lately that you don’t even want to go online to check how your stocks are doing – because you’re afraid of what you’ll see?
Are you worried about the U.S. economy – and your long-term financial security – in this unbelievably volatile and chaotic bear market?
Learn More about Adam’s
Stock Chart Analysis & Dynamic Trading System
|
|

Better
Business Bureau
|
|
Click on authors name
to learn more
|
| |
|
|
Inside Trading brings you Adam Oliensis this week, who talks about using volume analytics as a trading tool.
Lee Gettess provides our next bit of insight with a video covering his market expectations for the next week.
Then, Stephen Bigalow shares a video about Doji Candlesticks – how to interpret them and apply them in your trading.
Last, Andy Chambers covers his Weekly Market Line in the Sand newsletter.
Enjoy!
Adrienne LaVigne
TradeWins Publishing
 |
|
Volume Analytics
by
Adam Oliensis
The following
is an excerpt from Adam Oliensis' Stock Chart Analysis & Dynamic Trading System
We use volume as a secondary tool, one that can provide confirmation or non-confirmation (divergence).
On Balance Volume
On Balance Volume (OBV) is a cumulative total of each day’s volume. When the closing price increases, that day’s volume is added to the cumulative total. When the price declines, volume is subtracted from the total. A formula for OBV is:
RunTot(IF C > C[-1] THAN V ELSE IF C < C[-1} THEN –V ELSE 0
Where RunTot adds today’s value to the previous days’ value.
C = Closing Price
V = Volume
C[-1] = The prior period’s closing price (yesterday on a daily chart).
In English, the formula above reads like this: If today’s close is greater than yesterday’s close, then add today’s volume to the running total. If today’s close is less than yesterday’s close, then subtract today’s volume from the running total.
Below is what it looks like on a Dow Jones Industrial (DJ-30) chart.
The OBV line (in the lower pane) shows some interesting features. First, in Box A it confirms the strength of the downtrend, making a series of lower lows and lower highs. Then, in Box B it shows us that the bounce off the late July low is not very strong. The pattern on the OBV line is slower to begin a significant retracement of the decline than is the price. Finally, in Box C, OBV confirms that the bounce up is failing as it makes lower lows and then lower highs, suggesting further downside movement.
We use OBV to see if volume is confirming or diverging from price action. While this indicator can be useful, it’s still a bit crude. For example, if a stock closes up by $0.10, all the volume gets counted as bullish. The OBV line responds to a rise of $0.10 by exactly the same amount as it responds to a rise of $1.00.
On a high volume Doji candle (in which the opening and closing price are very close to one another), OBV can be somewhat misleading, depending on whether the stock closes up or down by just a few clicks. OBV is valuable in that it gives you something of interest almost every day. However, the indicator lacks some nuance, some ability to represent markets that are ambivalent, and to distinguish those from markets that are more galvanized in a particular direction.
Accumulation/Distribution
The Accumulation/Distribution (A/D) Line makes some effort to account for markets that might be speaking more subtly.
The Accumulation/Distribution Line is the running total of weighted volume. The A/D Line, or Volume Accumulator, was developed by Larry Williams and is a modification of the On Balance Volume indicator.
RunTot((((C – L) – (H – C))/(H – L)) * V)
Where RunTot = Running Total
C = Closing Price
L = Low of the period
H – High of the period
V = Volume
Volume Analytics
|
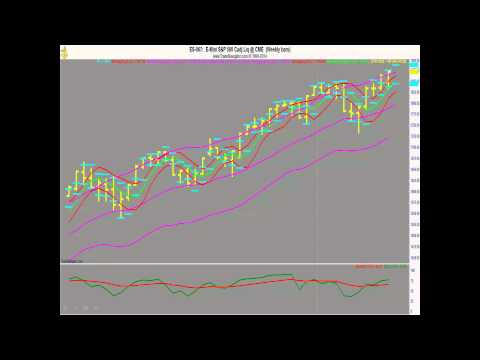
Lee
Gettess' Market Sense
by Lee Gettess
Lee
Gettess is a top trader who is excited
to bring you his video newsletter.
Each week, Lee will share his predictions
on what he anticipates from the bond
and S&P markets.
Watch
Video
|
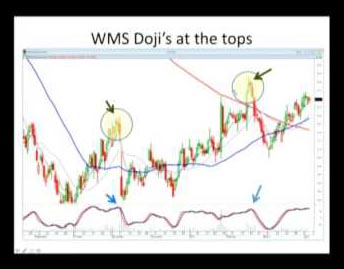
Doji Candlesticks
by Stephen Bigalow
The following
is a clip from Steve Bigalow's How to Apply Candlesticks for Profit
In this segment from Steve Bigalow's 'How to Apply Candlesticks for Profit' DVD, he reviews different types of Doji candlesticks and explains what each one represents. He covers the Doji "rules" and how to apply them in your trading. Using bar charts with candlesticks, Steve walks us through how to read the signals and use them to create profitable trade opportunities.
Watch Video
|
Weekly Market Line in the Sand
by Andy Chambers
The following is an excerpt from Andy Chambers’ Weekly Market Line in the Sand
Every week Andy publishes his “Weekly Market Line in the Sand” newsletter. The following are trade updates from his most recent issue.
DOW Futures Weekly: The upside breakout in the Mini Dow futures points to a further advance. The current targets are 20,000 and 22,500. A weekly close below 17,418 would put the bullish outlook on hold.
DIA Weekly: The bullish breakout points to a further advance. The initial targets are 200 and 210. A weekly close below 178.64 would put the bullish outlook on hold.
We want to buy the DIA January 19th 2018 190 call at 8.10 limit. Always be prepared to risk the premium paid.
To Learn More Click Here
|
|