.jpg "TradeWins Publishing")
Follow
Us:    
|
 |
Larry Williams wrote his first best-seller, “How I Made $1,000,000 Trading Commodities Last Year,” from his own personal experience. Years later, he continues to win laurels for his public trading contest performance – shattering all records by turning $10,000 into $1,147,000 in one year – and for his highly-rated newsletter.
In between trading, researching and developing trading tools, teaching, and writing, Larry managed to run twice for the U.S. Senate as well as 65 marathons. He holds a higher degree in archeology and has manned several expeditions. Larry's long list of best-selling books includes 1982's How to Prosper in the Coming Good Years which accurately forecasted the largest bull market and surge in economic growth in American history. He is a past board member of the National Futures Association and the recipient of numerous awards, including Futures Magazine's first Doctor of Futures Award, the Omega Research Lifetime Achievement Award, Significant Sig (a Sigma Chi acknowledgement), and on October 6, 2002 the mayor of San Diego declared that day as Larry Williams' Day.
|
Future Millionaires Trading Course
Larry Williams traded his way to $1 million in a year... and then turned around and did it again in a public trading contest...
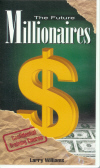
This video course teaches you the methods he used to achieve that remarkable performance - so you can do the same!
First, He Made A Million Dollars...
Larry Williams is no ordinary investor. He began following the stock market in 1965. Soon thereafter, he began trading futures. Within a few years, he was making over $1 million in profits. In 1973, he wrote the best-selling book, How I Made $1 Million Trading Commodities Last Year.
...Then, He Did It Again!
Learn More About
The Future Millionaires Trading Course
|
|

Better
Business Bureau
|
|
Click
on authors name
to learn more
|
| |
|
|
Inside Trading features Larry Williams this week. In his article, Larry reveals how trading a key reversal pattern is not effective in all markets.
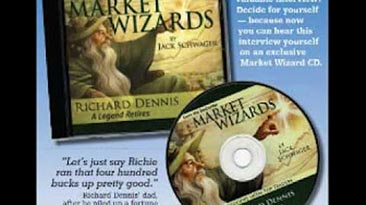
Then, Jack Schwager shares a video clip from his Market Wizards DVD.
Wendy Kirkland talks about making the right investment choices in stock equities.
Last, Chris Verhaegh presents his PULSE Options Weekly Newsletter.
Enjoy!
Adrienne LaVigne
TradeWins Publishing
 |
|
A Reversal on the Key Reversal
by
Larry Williams
The following
is an excerpt from Larry Williams' The Future Millionaires Trading Course
I want to talk about a price pattern that is simply a legend in its own time. It involves a price reversal day. We’ll use the definition that traders have used for the last 50 or 60 years. We will call a ‘reversal day’ any day whose low was lower than the previous day, but whose close is higher than the previous day’s close. This indicates a reversal, since the market went down to new lows for the day, then came back, with buying pressure, closing higher than yesterday’s close. This is a simple key reversal. Depending on which trader you talk with, this is either a phenomenally good, or an astoundingly good buy point.
The records indicate otherwise...
The table below shows the performance of these key reversal days in Standard and Poor’s, Kansas City Value Line, Silver, Treasury Bonds, Pork Bellies, Beans and the Swiss Franc. The study covers 5 years in the nearby month, from 1982 through 1986. The only exceptions are the Stock Indexes, which started trading in 1982, and Silver, where we used 1981 as a start point because 1980 was such an extraordinary year.
As you read down the column you will see the percentage of times that prices are higher X number of days after the occurrence of the reversal. To make certain that we weren’t getting just any day for the first set of data here, we made certain that the low of the key reversal day was the lowest low of the last eight market sessions. This tells us the market was in fact oversold. Thus, we should have an expectation of a rally.
The numbers are the most impressive for the Standard & Poor’s. Notice that one day after the occurrence of the reversal, we closed higher the next day 63.01% of the time. 64.62% of the time we were higher two days later and five days later we were higher 52.31% of the time. If we go all the way out to 15 days after the occurrence of the key reversal in the Standard & Poor’s, we close higher 70.70% of the time! It looks like we’ve got something here… this looks interesting. Let’s now turn our attention to the Value Line and look out 15 days later as well. Bingo, again we’ve got a good number, 62.50% of the time we were higher 15 days later.
A Reversal on the Key Reversal
|
Market Wizards
by Jack Schwager
How do some of the world's most successful traders amass millions of dollars in a year... or sometimes in just hours? Are they masters of a priceless wizardry or simply the very lucky winners in a random market lottery that allows only a few players to become fantastically wealthy? Listen as Jack Schwager explores the answers to these questions.
Watch
Video
|
Stock Equities
by Wendy Kirkland
The following
is an excerpt from Wendy Kirkland's Wealth Building with Weekly Options
Modern economies offer any number of investment choices – vehicles through which you put money to use to make profits, earn interest, preserve value, create portfolio growth, and so forth. From interest-bearing checking and money-market accounts to treasury bills (T-Bills) to municipal bonds, we have many investment choices.
The stock market is the place where individual investors (people and companies) own a share of the action and own a share of the risk, too. Their ownership is measured in increments or units called stocks. When companies sell shares of stock, they are selling a share of ownership in that business or conglomerate of businesses.
When a company first offers its stock for sale, it is called an IPO - Initial Public Offering. This is the introduction of its stock to the public. After shares of the stock have been available for a while, often options will become available. If the options are popular, weekly options may then also be offered.
Stock Equities
|
PULSE Options Weekly Newsletter
by Chris Verhaegh
The following is an excerpt from Chris Verhaegh’s PULSE Options Weekly Newsletter
Every week Chris Verhaegh publishes his “PULSE Options Weekly Newsletter”. The following is from his most recent issue.
Long-Term Opportunity
A few weeks ago I shared how I purchased the VXX January 2017 Monthly Expiration $38 Put for an average price of $6.38 because VXX had traded above its upper Bollinger Band.
I went on to share how I have successfully traded this setup 63 of the last 65 times (give or take, I lost track somewhere around 50). This setup has us buying a Put option with an expiration at least three months in the future with a strike price that slightly In-the-Money (ITM).
We buy all this time for two reasons: First we buy extra time in case we need it. Some of those 60+ profits took more than a month to earn. The other reason we buy extra time is that sometimes we can catch an extended trend. That is the gains can pile on.
To Learn More Click Here
|
|