.jpg "TradeWins Publishing")
Follow
Us:    
|
“Winning Secrets from a Professional Options Trader!”
Tomorrow, November 17th at 3:30pm CDT, Join Wendy Kirkland for a FREE educational webinar. Wendy will discuss little known option trading secrets to help boost trading success and increase potential percent of profit.
Space is Limited...
Sign Up Now
All attendees will receive a FREE giveaway courtesy of Wendy!
Click Here to Reserve Your Space.

|
|
Joe Duffy is the president of KeyPoint Market Analytics Inc., and a member of the National Futures Association. Joe has been published extensively in the areas of trading and market analysis and has been a speaker at many international conferences. He is a three-time top ten finisher in the United States Trading Championships with actual real money annualized returns of 121%, 243% and 432%. As a mechanical trading strategy developer, Joe brings 25 years of real-time experience watching markets on an intraday basis.
|
Inside Secrets of the
MILE-HIGH CASH CLUB

If you hated school and the word “study” invokes dreaded memories from your youth, FEAR NOT. Because Darrell and I have ‘jumped through hoops’ to make this home study course a surprisingly easy and fun way for you to get your ‘Wealth-Building Ph.D.’ And then seek your fortune as a trader.
Depending on your trading background, you may only need a quick review of some sections. Or you may want to concentrate more on one area than another. Periodic quizzes will help you determine how well you grasp the material.
Learn More About
Inside Secrets of the
Mile-High Cash Club
|
|

Better
Business Bureau
|
|
Click
on authors name
to learn more
|
| |
|
|
Inside Trading this week features Joe Duffy who specializes in technical trading and building systems. In his article, Joe outlines how the price of an option is determined.
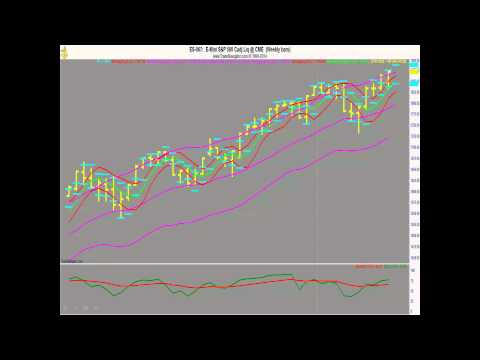
Then, we check in with Lee Gettess for his S&P and bond market predictions.
Duane Davis provides the next piece about intraday trading using 60-Minute charts.
Last, Chuck Hughes offers his Guaranteed Real Optioneering Winners - Optioneering Newsletter.
Enjoy!
Adrienne LaVigne
TradeWins Publishing
 |
|
Options Pricing
by
Joe Duffy and Darrell Jobman
The following
is an excerpt from Joe Duffy and Darrell Jobman's Inside Secrets of the Mile-High Cash Club
The following four major factors go into determining the price – the premium – of an option.
Price of the Underlying Instrument – Whatever moves the price of the underlying instrument will have an effect on the price of an option, with the extent of the effect depending on the proximity of the underlying price to the strike price. Options prices do not track the price of the underlying instrument precisely. An in-the-money option will react differently than an out-of-the-money option.
Strike Price – The strike price is the key pricing point against which all elements of the options price can be compared. It is the dividing line between profit and loss and whether an option will be exercised at time of expiration. Options at a strike price that is far removed from the price of the underlying instrument may have little day-to-day movement, whereas options at a strike price close to the underlying price will reflect changes in the underlying price more closely.
Time Remaining Until Expiration – When someone talks about “buying time” and hoping something good will happen to them during the time they have, they might be talking about an options buyer. The more time left in the life of an option, the more value the option has, all other things being equal. Every passing day reduces the time value, with this erosion in value beginning slowly then increasing rapidly during the last 30 days or so before expiration until it reaches zero. The only value in an option at that point is its intrinsic value. Consequently, an option is known as a “wasting asset”. Time decay can work against an option buyer who is waiting for an option position to move above a breakeven point.
Options Pricing
|
Lee
Gettess' Market Sense
by Lee Gettess
Lee
Gettess is a top trader who is excited
to bring you his video newsletter.
Each week, Lee will share his predictions
on what he anticipates from the bond
and S&P markets.
Watch
Video
|
Trading the 60-Minute Charts
by Duane Davis
The following
is an excerpt from Duane Davis' DIY Success Package
To get an appreciation of what it is to trade using intraday charts, let’s take a look at a couple of examples using 60-Minute charts. The first chart below is of the EUR/USD. Let’s say that it’s 4:00 PM ET, and you decide that you’re going to trade the European Session when it starts 11 hours from now at 3:00 AM. Looking at your 60-minute chart you notice the market is in the process of forming a symmetrical triangle. You also notice that if the market happens to break to the upside and penetrate the upper line of the triangle, the price will probably challenge the recent high just above 1.4950.
As you continue your analysis and you look at the ‘bearish’ side of the picture, you notice that if the market should break to the downside of the triangle, support should come in at the recent high around 1.4730 (the dotted line on the chart). To make these charts easier to see, we may leave off additional indicators such as Bollinger bands or the RSI. However, in your analysis, it’s always worth applying these indicators to help pinpoint overbought and oversold areas.
Your preliminary analysis is telling you that you’ll be entering two possible orders: One order to buy the EUR/USD on a breakout above 1.4910, and another to sell on a breakout below 1.4800.
Trading the 60-Minute Charts
|
Guaranteed Real Optioneering Winners
by Chuck Hughes
The following is an excerpt from Chuck Hughes’ Optioneering Newsletter
Every week Chuck Hughes publishes his “Optioneering Newsletter”. The following are trade updates from his most recent issue.
Mini Dow Futures Weekly: We are looking at the Mini Dow futures chart because it includes the huge decline that occurred on election night. That’s a big bullish weekly reversal! The big reversal is a sign that the recent correction is over and the uptrend is resuming.
The first profit opportunity we will consider is SOXL, the Direxion Daily Semiconductor Bull 3X Shares ETF. SOXL seeks to yield results that correspond to three times the daily performance of the PHLX (Philadelphia Stock Exchange) Semiconductor Sector Index.
SOXL Monthly: The monthly chart shows that SOXL hit a new record high last month. New record highs are bullish.
To Learn More Click Here
|
|