.jpg "TradeWins Publishing")
Follow
Us:    
|
Are You Coming?
You are invited to a special free online training that will be starting soon: "How to make money with stocks and options even if you are wrong half of the time"
There's still time to join...
Click Here
By the end of this training, you’ll know how to make money with stocks and options even if you're wrong half of the time.
We hope you enjoy the webinar!
Register Here Now
It's FREE!

|
|
Thomas DeMark has spent 28 years in the investment business. DeMark has been a consultant to large hedge fund and mutual fund managers, and his many clients have included George Soros, Paul Tudor Jones, Union Carbide, IBM and many others. The featured speaker at numerous conferences, he has also written several articles for financial magazines and two successful books on market timing, The New Science of Technical Analysis and New Market Timing Techniques.
|
Tom DeMark's
The New Science of
Technical Analysis
"This may be the most imaginative, informative and valuable investment book ever written!"

Tom's breakthrough methodology incorporates a number of new technical indicators that, when used appropriately, are incredibly accurate at forecasting changes in market direction. These indicators are price anticipatory. They consistently and accurately identify market entry and exit points to coincide exactly with upcoming turning points in market trends.
While highly scientific, Tom's indicators are startling in their simplicity. You don't need a Ph.D. in math to understand or apply them. All you need is a basic understanding of the markets and the dynamics of price movement.
Learn to Trade the DeMark Way
The New Science of Technical Analysis
|
|

Better
Business Bureau
|
|
Click on authors name
to learn more
|
| |
|
|
Inside Trading this week features an article from Tom DeMark who explains how to use specific ratios to forecast price movement in the marketplace.
Lee Gettess provides our next bit of insight with a video covering his market expectations for the next week.
Next, Don Wellenreiter shares strategies used to hedge your portfolio.
Last, Chris Verhaegh covers his PULSE Options Weekly Newsletter.
Enjoy!
Adrienne LaVigne
TradeWins Publishing
 |
|
Trend Factors
by
Thomas DeMark
The following
is an excerpt from Tom DeMark's The New Science of Technical Analysis
Often, both traders and investors preoccupy themselves with market rhetoric. As far as I am concerned, however, one distinction they fail to recognize or to acknowledge is the difference between the duration and the degree of price moves. Invariably, if I were to ask for definitions to widely used market terms such as short, intermediate, and long term, I would wager that most, if not all, would respond in temporal terms. Although the responses might vary somewhat, I would expect to hear that short term relates to moves of less than one month’s duration, intermediate term to moves longer than one month but shorter than six months, and long term to moves lasting more than six months. These labels may have been appropriate prior to the 1980s, but because of increased volatility in the financial markets, they have become outdated.
Moves that in the past consumed weeks or months are being fulfilled in days or hours. Because of market illiquidity, the speed of news dissemination, the herd instinct of fund managers and other factors, this trend continues. Consequently, I apply the descriptions of short, intermediate, and long term to percentage price movements rather than to specific time intervals. For example, I consider moves of less than 5 percent to be short term, moves of 5 to 15 percent to be intermediate term, and moves greater than 15 percent to be long term. These definitions apply regardless of the time required to accomplish these moves. In this context, I rely on an analytical tool I developed many years ago to forecast the inception of trend moves of an intermediate to long-term variety. I refer to the set of specific ratios I use as Trend Factors™.
In the early 1970s, I observed a dominant tendency for various markets to exhibit support and resistance at price intervals defined by percentage retracements from preceding price peaks and troughs.
Trend Factors
|
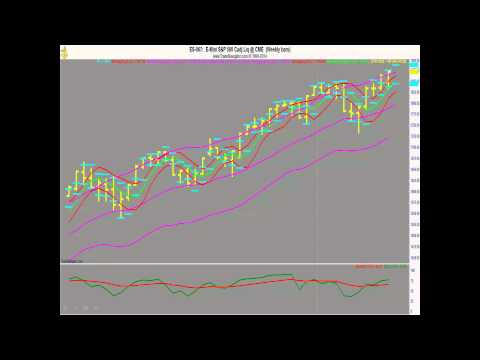
Lee
Gettess' Market Sense
by Lee Gettess
Lee
Gettess is a top trader who is excited
to bring you his video newsletter.
Each week, Lee will share his predictions
on what he anticipates from the bond
and S&P markets.
Watch
Video
|
Strategies Used to Hedge Your Portfolio
by Don Wellenreiter
The following
is an excerpt from Don Wellenreiter's Millionaire Secrets for the Average Guy
The practice of hedging simply involves the use of options (or futures) with pre-existing or planned stock market investment to offset the change in value of the equity position by the performance of the options positions.
Synthetic Futures Position
A synthetic position refers to both the buying of a call and selling of a put; or the buying of a put and the selling of a call. For our purposes here, we are discussing how to hedge a portfolio, so we will only focus on the buying of a put and the selling of a call. This type of strategy is used in lieu of selling a futures contract short. Depending on your outlook for the stock market you would sell a call at, near, or out-of-the-money. You should calculate what reasonable gain you would accept in your portfolio to decide where you would sell the call.
As an example, with the December 1998 S&P trading near 1124 after beginning the year at 1010 (a year to date gain of just over 11%), you may decide that you would be willing to lock in gains of 22% on the upside, 3% on the downside.
Hedge Your Portfolio
|
PULSE Options Weekly Newsletter
by Chris Verhaegh
The following is an excerpt from Chris Verhaegh's PULSE Options Weekly Newsletter
Every week Chris publishes his “PULSE Options Weekly Newsletter”. The following is from his most recent issue.
First Things First: This upcoming trading week will be shortened by one day because the Stock Market will be closed on Friday, April 14th to observe the Good Friday Holiday. And as such options expiration will occur one day earlier on Thursday, April 13th .
In Trading: The stock in question is General Motors (GM). I know most of you have heard of it. My Assistant shared with me late on Monday, April 3rd that GM had sold off quite dramatically that day.
Basically General Motors had a large sell-off but not large enough to go to what we might consider an “Extreme” condition. We both felt that GM might bounce higher from this low (which it did on Wednesday), but neither of us were excited enough to buy a GM Call option.
So instead of simply buying a GM Call option, I both bought one and sold one. Actually I entered a Diagonal Call Spread.
To Learn More Click Here
|
|