
Knowing When to Buy and Sell
By: Chuck Hughes
The following excerpt is taken from Chuck Hughes’ Sure Thing Profit Secrets
Moving Average lines are a great trading tool that tell us when to buy and when to sell a stock. I know the term Moving Average Line may seem complicated but a moving average line is simply the average closing price of a stock over a specified time period. For example, the 50-Day Moving Average line represents the average closing price of a stock over the past 50 days.
Many times the real price trend of a stock can be obscured by the daily price fluctuations. The daily price chart below for Akorn stock covers about a 2 month period. The vertical bars display the daily price movement of the stock.
This price chart shows a lot of daily price swings for Akorn stock. Despite the daily price fluctuations the stock price was little changed at 6.49 over the 2 month period.

Let's take another look at a price chart for Akorn stock that covers a longer time period but includes the 2 month period just mentioned. This price chart also includes the 100-Day Exponential Moving Average line for Akorn stock. I prefer to use Exponential Moving Averages (EMAs) over Simple Moving Averages as I have found EMAs to be more accurate in determining the price trend. Exponential Moving Averages give more weighting to recent price movements than Simple Moving Averages which give every day an equal weighting.
100-Day EMA Line is Sloping Up
Clearly Indicating a Price Up Trend

The 100-Day Exponential Moving Average (EMA) line is sloping up clearly indicating Akorn stock is in a price up trend.
Moving average lines give us an instant visual reference of the current price trend of a stock.
1) If the moving average line is sloping up, the stock is in a price up trend and buying pressure is exceeding selling pressure. The stock should be bought.
2) If the moving average line is sloping down, the stock is in a price down trend and selling pressure is exceeding buying pressure. The stock should be sold.
It is that simple! Moving averages tell us when to buy or sell instead of trying to predict the future price movement of a stock. You can easily and quickly obtain moving average lines from numerous websites which will be covered shortly.
Buy and Sell Signals
One of the easiest ways to clarify whether a stock is a 'buy' or a 'sell' is to look at the shorter term 50-Day Exponential Moving Average (EMA) line in relation to the longer term 100-Day Exponential Moving Average (EMA) line. I use the 50/100-Day EMA buy and sell signals for intermediate term trades of three to 12 months. And I use MACD for shorter term trades and the Major Trend System for longer term trades which will be covered shortly.
If the shorter term 50-Day line is above the longer term 100-Day EMA line it indicates the price momentum for the stock is to the upside which confirms the price up trend. We should buy the stock.
If the shorter term 50-Day EMA line is below the longer term 100-Day EMA line it indicates the price momentum for the stock is to the downside which confirms the price down trend. You should sell the stock if you are an intermediate term trader.
50-Day EMA Line Above 100-Day EMA = Price Up Trend = Buy 50-Day EMA Line Below 100-Day EMA = Price Down Trend = Sell |
Buying and Selling Pressure
When the shorter term 50-Day EMA line is above the longer term 100-Day EMA line it is an indicator that the buying pressure for a stock is exceeding the selling pressure. And the most likely future price movement of the stock is up. The stock should be bought.
When the shorter term 50-Day EMA line is below the longer term 100-Day EMA line it is an indicator that the selling pressure for a stock is exceeding the buying pressure. And the most likely future price movement of the stock is down. You should sell the stock if you are an intermediate term trader.
50-Day EMA line Above 100-Day EMA = Buying Pressure Exceeding Selling Pressure 50-Day EMA line Below 100-Day EMA = Selling Pressure Exceeding Buying Pressure |
'Buy' Signal Example
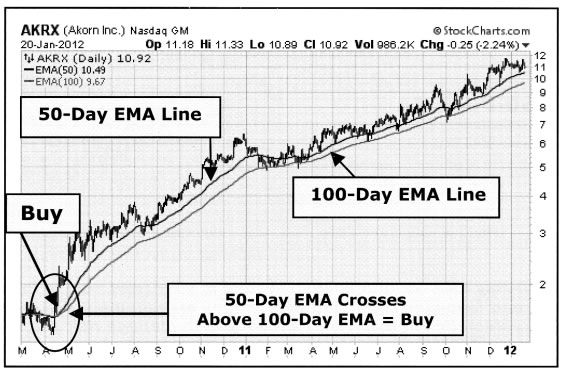
Let's look at an example of a 'buy' signal. The Akorn stock daily price chart below displays the 50-Day EMA line and the 100-Day EMA line. The moving average lines indicate that Akorn stock entered a price 'up' trend in April (circled) as the 50-Day EMA crossed above the 100-Day EMA line at around the 1.95 price level.
When the 50-Day EMA crossed above the 100-Day EMA, it was a good indication that buying pressure was exceeding selling pressure and you want to buy Akorn stock.
As long as the 50-Day EMA line remains above the 100-Day EMA, Akorn stock remains in a price 'up' trend as this is an indication that buying pressure continues to exceed selling pressure. Akorn stock currently has about a 453% return since the buy signal occurred when the 50-Day EMA crossed above the 100-Day EMA. Monitoring the 50-Day and 100-Day EMA lines is an easy and effective way to determine the current price trend which tells us if we should be buying or selling a stock. As long as the 50-Day EMA line remains above the 100-Day EMA line, Akorn stock remains a 'buy'.
If the 50-Day EMA crosses below the 100-Day EMA it would indicate a reversal to a price 'down' trend as the selling pressure is now exceeding the buying pressure. If you are an intermediate term trader you should sell the stock when this occurs. We will look at an example of a sell signal next.
50-Day EMA line Above 100-Day EMA line = Buy
Sell Signal Example
Let's look at an example of a sell signal. The daily price chart below shows the daily price movement and the 50-Day and 100-Day EMA lines for Merck stock. This chart reveals that in February the Merck 50-Day EMA line crossed below the 100-Day EMA line (circled) resulting in an EMA System 'sell' signal for Merck stock.
When the 50-Day EMA crossed below the 100-Day EMA it was a good indication that selling pressure was exceeding buying pressure. If you are a shorter term investor and owned Merck stock you would want to sell your shares as the price trend is 'down' and at this point the length and severity of the price decline is still unknown.
As long as the 50-Day EMA line remains below the 100-Day EMA line Merck stock remains a 'sell'. Merck does not qualify as a buy until the 50-Day EMA line crosses above the 100-Day EMA line. Monitoring the 50-Day and 100-Day EMA lines is an easy and effective way to determine the current price trend which tells us if we should be buying or selling Merck stock.
50-Day EMA Below 100-Day EMA = Sell

The 50/100-Day EMA trend following system is your road map to investing success. Trend following combined with money management discipline is a powerful, systematic approach that allows you to manage risk and turn your investing into a business.