
Keltner Channels: Timing Our Entry
By: Chuck Hughes
The following is an excerpt from Chuck Hughes' Lifetime Income System
I use a simple but powerful trend following system I call PowerTrend that tells us if we should be buying or selling stocks. The concept behind trend following is very simple. When the trend is up, we buy stocks. When the trend is down, we sell stocks.
When the price of a stock on the last trading day of the month closes above the 10-Month Simple Moving Average (SMA), the stock is on a PowerTrend ‘buy’ signal. We can either buy the stock that day or use the Keltner Channels to help us time a low risk entry. This allows me to purchase a stock after a PowerTrend buy signal.
The Keltner Channels function as an overbought/oversold indicator. The goal is to purchase a stock that is on a PowerTrend buy signal, but is temporarily oversold. This helps me to enter a stock after it has already moved up in price with a low risk entry.
Overbought is a term used to describe a stock that has been increasing in price over a period of weeks or months with very few price pullbacks. Oversold is a term used to describe a stock that has been decreasing in price over a period of weeks or months with very few price increases.
Stocks on a PowerTrend buy signal do not advance in a straight line. There are always price corrections or retrenchments along the way. Much like the tide, there is an ebb and flow in the price movement in stocks. This is the natural order of the markets… stocks advance and then the price declines inevitably as profit taking occurs.
Stocks can remain on a PowerTrend buy signal as these price declines occur as long as the price decline is not severe enough to cause the 1-Month price to close below the 10-Month SMA, which indicates a reversal to a sell signal.
The Keltner Channels are a valuable timing tool, as the channels can help us prevent buying stocks when they are in an overbought condition. When stocks become overbought they are vulnerable to profit taking and minor price declines within the context of remaining on a PowerTrend buy signal. The Keltner Channels can help us avoid buying stocks when they become overbought and instead buy stocks and call options when they become oversold.
When you avoid buying stocks that are overbought and instead buy stocks when they are oversold (but still on a buy signal), you increase your odds of selecting a profitable trade.
Let’s take a look at an example of the Keltner Channels and how they can help us select our entry point. The price chart below displays the daily price movement for Apple stock along with three Keltner Channels. There is an upper channel, middle channel (which is the dotted line), and a lower channel.
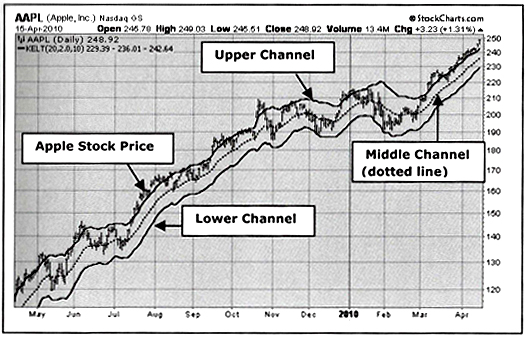
When a stock trades near the upper channel it is an indication the stock is becoming overbought and will most likely encounter selling pressure and then trade back down towards the middle or lower channel.
When a stock trades near the lower channel it is an indication the stock is becoming oversold and will most likely encounter buying pressure and then trade back up towards the middle or upper channel.
If you are considering buying Apple stock or call options, you don’t want to buy if the stock is trading near the upper channel, as there is a good chance the stock will encounter selling pressure near the upper channel and then decline in price.
It is better to wait until the stock trades near the middle or lower channel before buying. This results in a better entry as the stock most likely will trade back up towards the upper channel.
Circled on the chart below are examples of Apple stock trading above the upper channel. When a stock is trading above the upper channel it is better to wait for the stock to decline towards the middle or lower channel before buying. When a stock is trading near the middle or lower channel there is a good probability that it will rally back towards the upper channel.
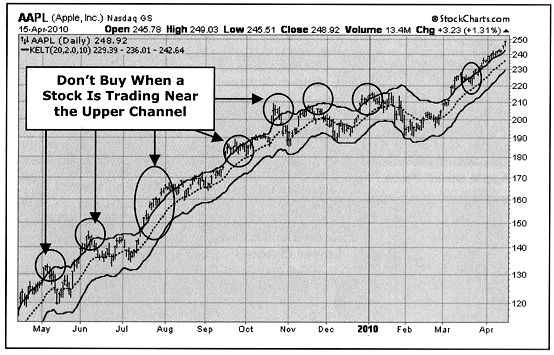
In each of these examples, after the stock traded above the upper channel it declined back towards the middle or lower channel within a week or two except for the example that occurred in mid-July. In this example the retracement took a little longer as the stock traded near the upper channel in mid-July and did not retrace back to the middle channel until mid-August. This happens occasionally in strong bull markets.